Top 3 price prediction Bitcoin, Ethereum, Ripple: Altcoin auto-MATIC carnage
- An illiquid asset and leveraged traders trigger a black day for cryptocurrencies.
- The search for stellar returns often leads to a total loss of capital.
- Risk management is vital in managing this type of suicidal investment.

The collapse of MATIC today in Asian session should help us not to lose sight of the reason why we entered the crypto market: preserving and making money.
According to the latest information, the highly leveraged bullish positions triggered the carnage.
The story of these fulminant falls is always the same and its ingredients are quite simple:
- Anxious traders with a tendency to take too much leverage.
- Market narrowness refers to the inability of the order book to absorb a high amount of orders. In these situations, the price slips in the direction of the avalanche, then activates protection stops that increase the chain effect. And so on, until the order book is balanced again.
- Leverage in trading can be a great ally or the worst enemy. In the subject matter of this article, a leveraged position against an avalanche movement leads to the closing of the trading position. The action is so fast, and the losses so heavy, that the "margin call" sequence followed by the "closing of all positions" is practically instantaneous.
As much as it now seems like something like that only happens in the cryptocurrencies market, readers surely know similar situations in any other quoted market.
What can we do to protect ourselves?
- We should never take heavily leveraged positions in illiquid assets. This type of asset is easy to move. Those responsible for manipulation only need to give the first push, leverage and lack of funds do the rest of the work.
- The total capital we dedicate to this type of adventure should not exceed 5% of our money.
- If we take leveraged positions, we should not wait for consolidations. Any profit made must be executed immediately, without giving time to the accumulation of positions on the opposite side.
ETH/BTC Daily Chart
The ETH/BTC pair is currently trading at the 0.02004 price level and is timidly looking green. The simple average of 100 periods shows a bullish profile that augurs a cross of the long-term bearish trend line at the 0.021 level.
The price of the ETH/BTC pair will tend to that range first and should continue to rise towards the 200-period simple average passage zone.
Above the current price, the first resistance level is at 0.0205, then the second at 0.02225 and the third one at 0.023.
Below the current price, the first support level is at 0.02000, then the second at 0.019 and the third one at 0.018.
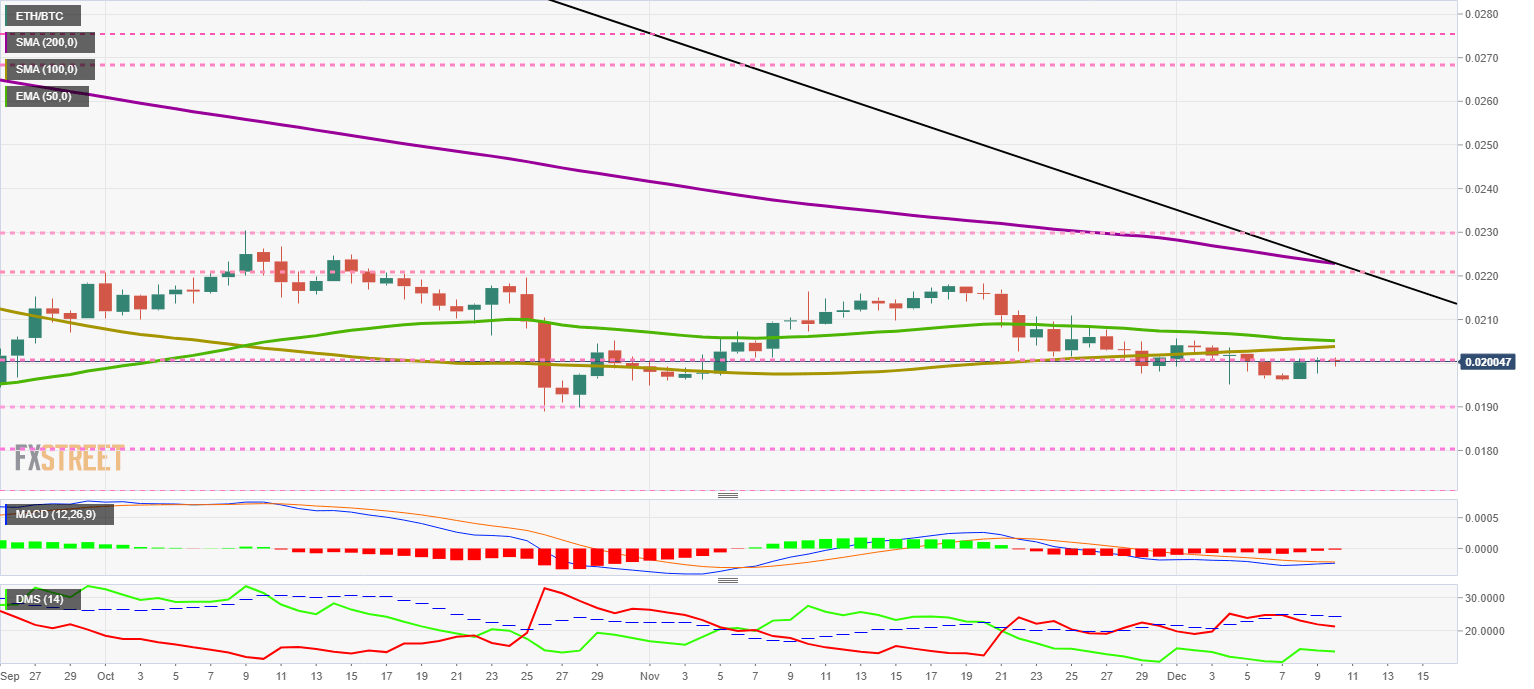
The MACD on the daily chart shows a bullish cross in development at the moment. The cross will culminate in the next few hours and should give way to a more positive tone in favor of the Ethereum.
The DMI on the daily chart shows bulls increasing trend strength against bears, which gradually lose power.
BTC/USD Daily Chart
The BTC/USD pair is currently trading at the $7,333 price level and points to a day of moderate price declines. Bitcoin's inability to beat the $7,500 daily close is a sign of weakness.
A stronger bearish move with a target at the $6,850 level cannot be ruled out.
Above the current price, the first resistance level is at $7,450, then the second at $7,500 and the third one at $7,600.
Below the current price, the first support level is at $7,100, then the second at $6,850 and the third one at $6,750.
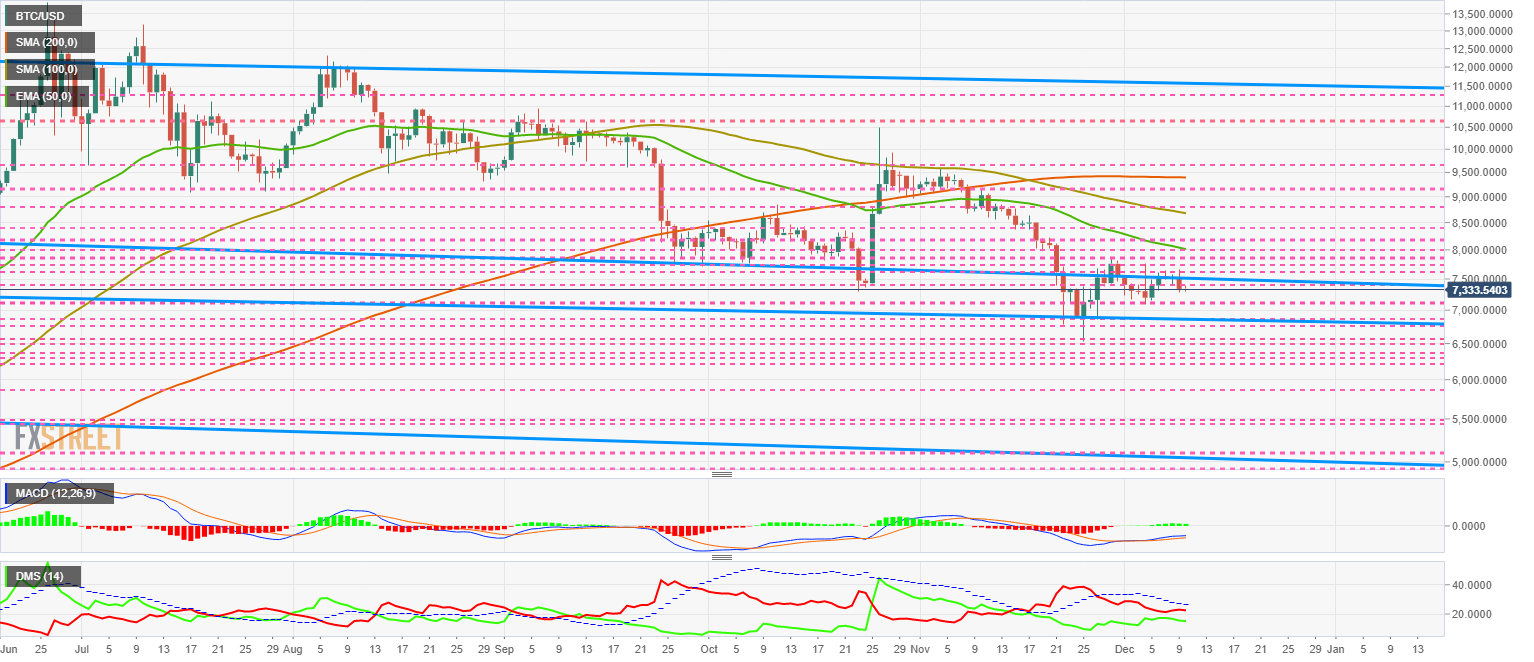
The MACD on the daily chart retains the bullish cross despite losing openness between the lines and the bullish incline. The closeness between the lines can cause a rejection movement to the price hike.
The DMI on the daily chart clearly shows “more-bullish” bulls in the same intensity with which bears follow it down.
ETH/USD Daily Chart
The ETH/USD pair is currently trading at the $147.3 price level, showing the difficulty of overcoming the resistance level at the $150 price level.
The release of the Istanbul upgrade has not meant any change in the Ethereum price.
Above the current price, the first resistance level is at $150, then the second at $155 and the third one at $160.
Below the current price, the first support level is at $145, then the second at $140 and the third one at $130.
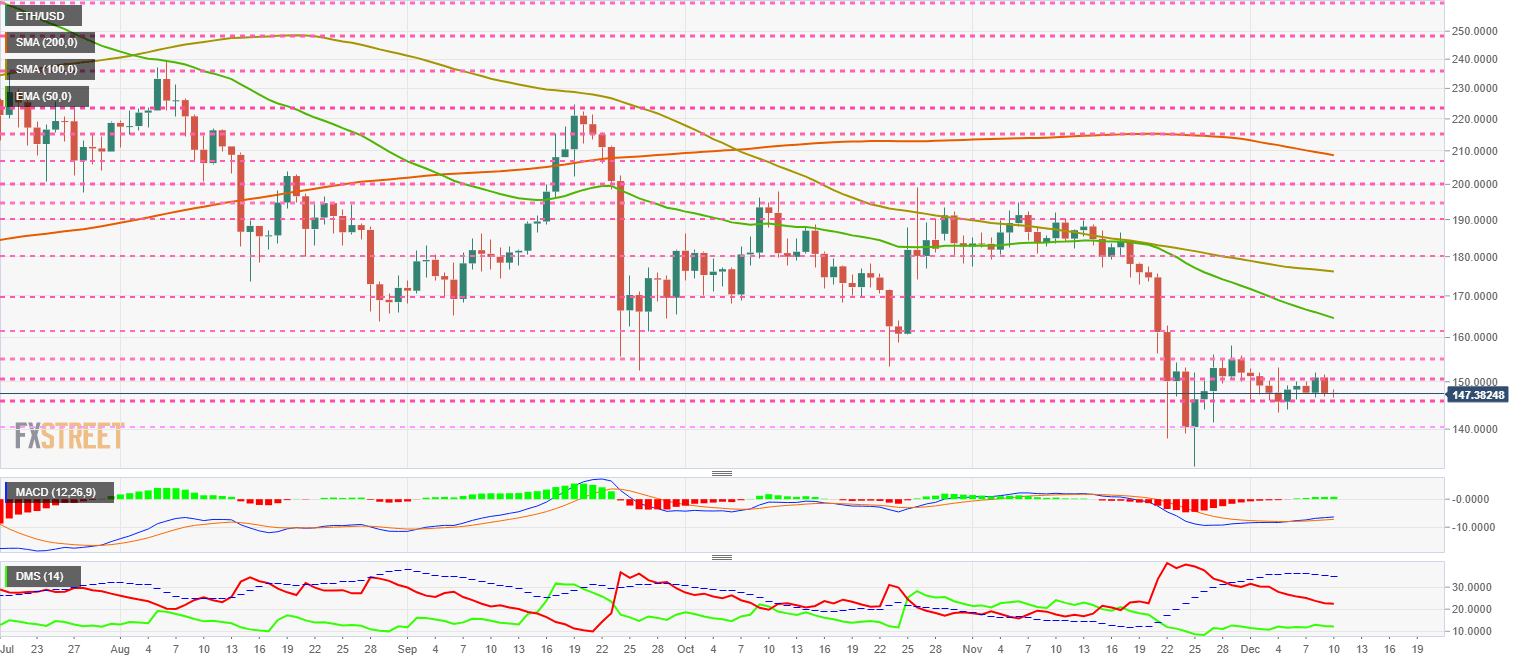
The MACD on the daily chart shows a slightly weakened bullish profile due to the impossibility of breaching the $150 price level.
The DMI on the daily chart shows the bulls gaining strength little by little. The bears, on the other hand, are continually losing trend-strength.
XRP/USD Daily Chart
XRP/USD is trading at the $0.223 price level, remaining within the same range as in the past few days.
Above the current price, the first resistance level is at $0.23, then the second at $0.245 and the third one at $0.248.
Below the current price, the first support level is $0.22, then the second level is $0.21, and the third level is $0.20.
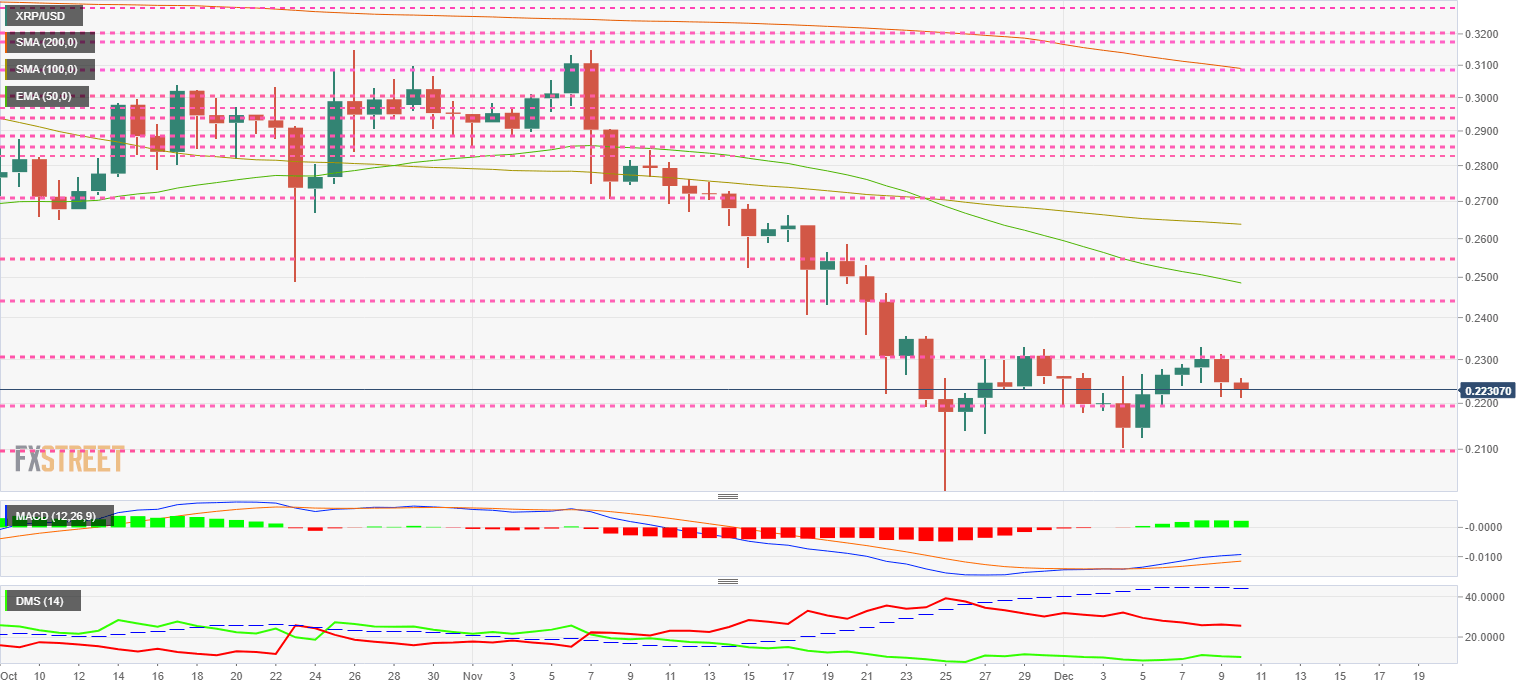
The MACD on the daily chart shows a clear bullish profile despite the sideways price in the last few days.
The DMI on the daily chart shows a small improvement in the activity level of the bulls, which nevertheless remain at deficient levels. The bears are gradually decreasing in their trend-strength level. A change of positions still seems distant.
Get 24/7 Crypto updates in our social media channels: Give us a follow at @FXSCrypto and our FXStreet Crypto Trading Telegram channel
Author

Tomas Salles
FXStreet
Tomàs Sallés was born in Barcelona in 1972, he is a certified technical analyst after having completing specialized courses in Spain and Switzerland. He expanded his technical training following the guidance of great experts on the financial markets.


