Top 3 Price Prediction Bitcoin, Ether, Ripple: Crypto market decides the road ahead
- The battle for dominance between Bitcoin and Ether reaches key levels.
- Bitcoin approaches the bullish scenario and seems to rest before the first attempt.
- XRP is not keeping pace with the top 2 and needs to react to stay in the lead group.

The crypto market is still deciding who will lead the next uptrend.
Bitcoin is using its position as the undisputed king of the crypto board to increase its dominance level to 67.64% of the market capitalization. It may seem like a lot, but we must remember that in February 2017, the same dominance metric reached 96%.
The eternal prince Ether, for his part, now has 8.45% of the market capitalization. It is interesting to note that Ether shares the percentage of capital that Bitcoin leaves free among more than 2500 tokenized projects.
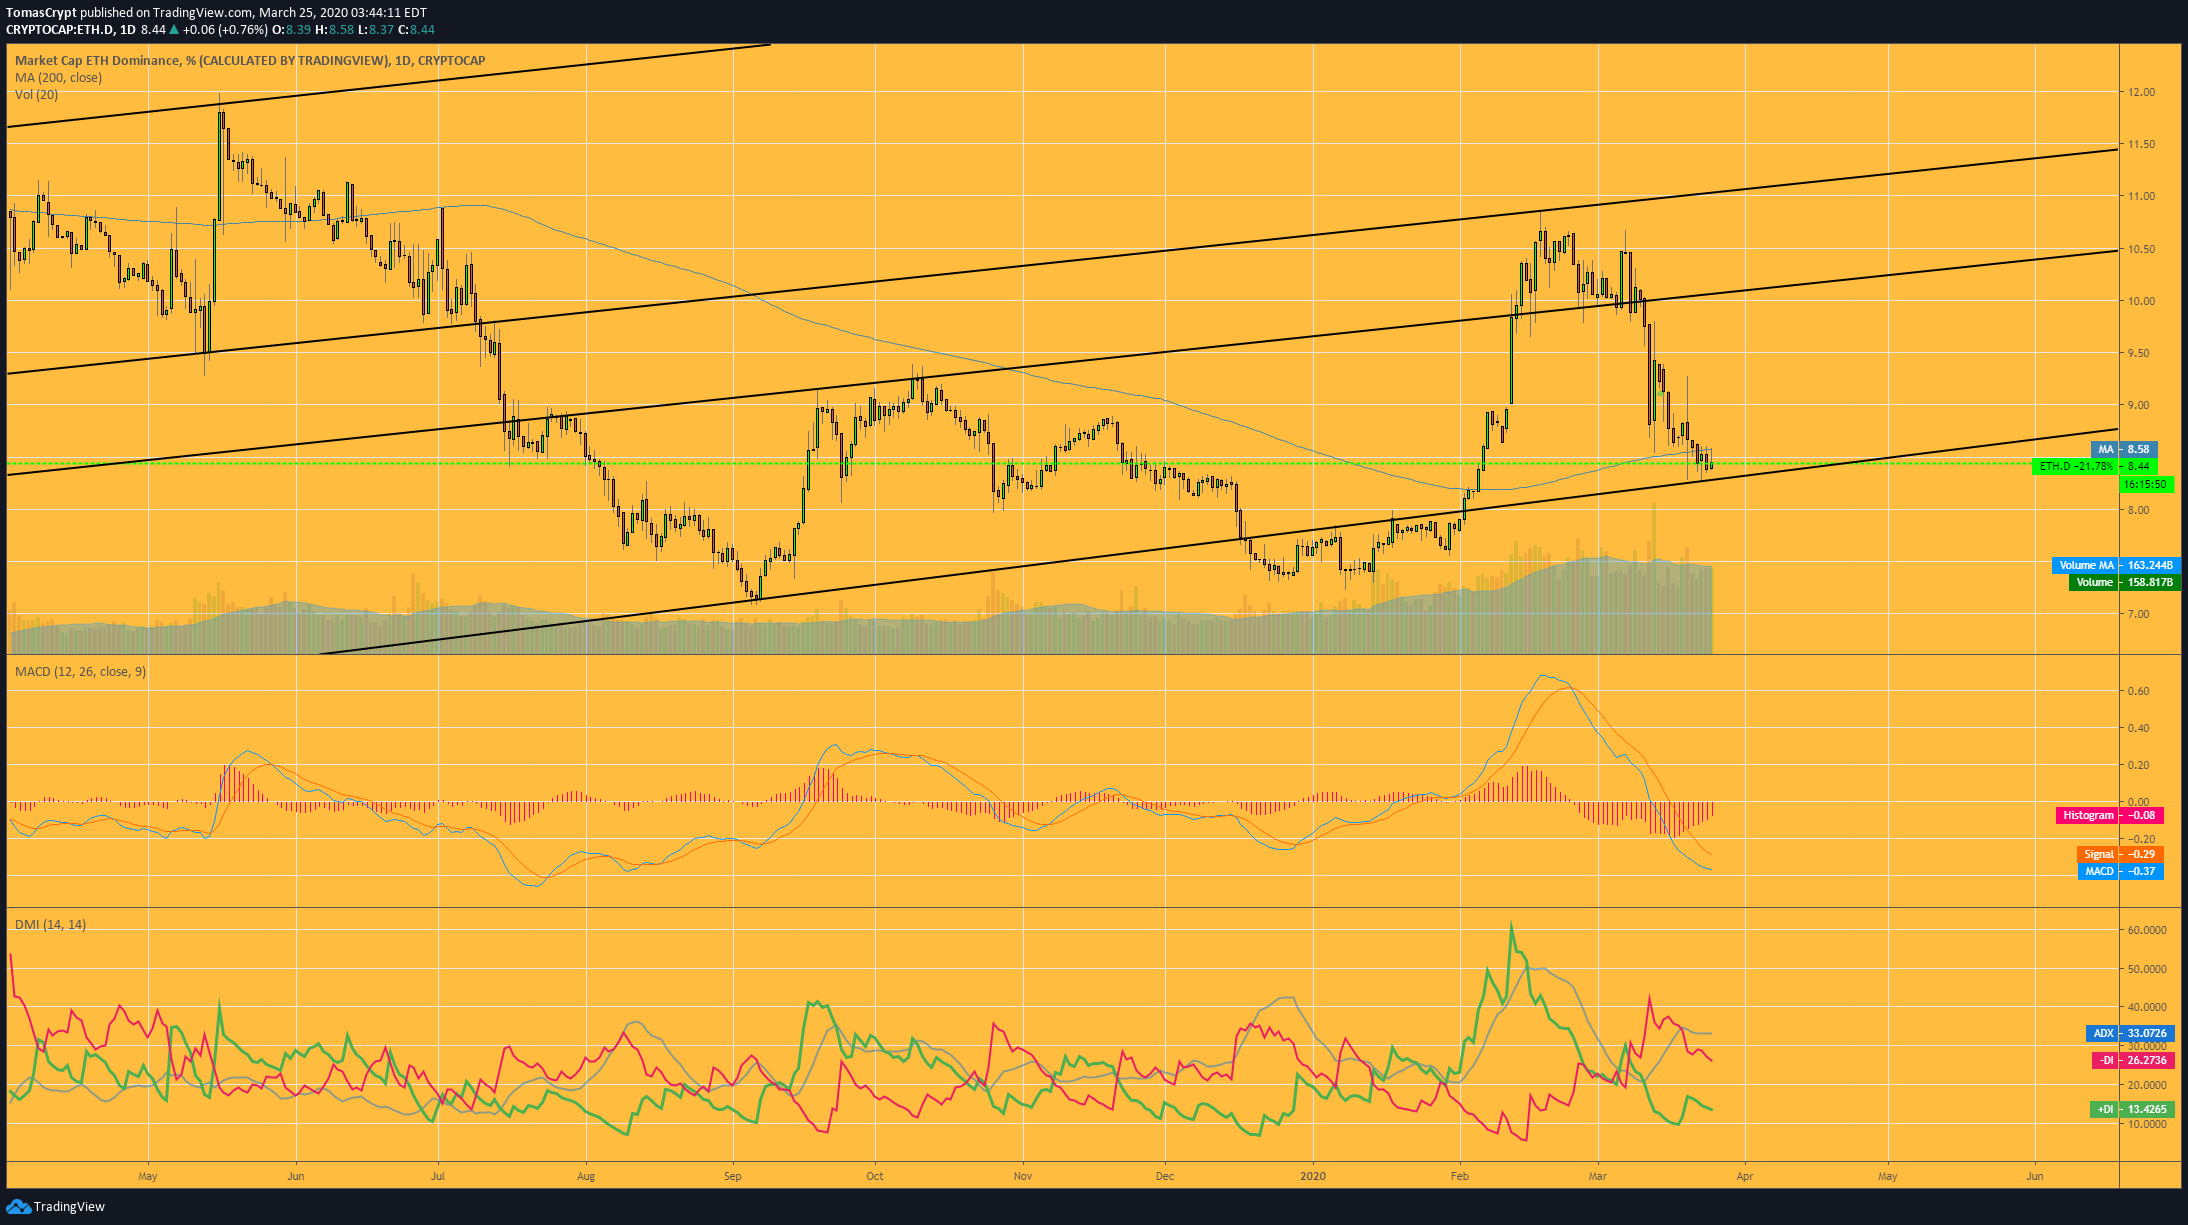
The situation of Ether is delicate as it is very close to losing the current support and could be lost in a very negative scenario. The MACD and Directional Movement indicators show structures that are compatible with a change in direction, but still need some time to be able to materialize it.
ETH/BTC Daily Chart
The ETH/BTC pair starts the session with gains, although short term in light of the immediate presence of the SMA200. The long-term moving averages continue to trend higher, so the market fund continues to be positive for the price.
Above the current price, the first resistance level is at 0.021, then the second at 0.022, and the third one at 0.0228.
Below the current price, the first support level is at 0.020, then the second at 0.018, and the third one at 0.019.
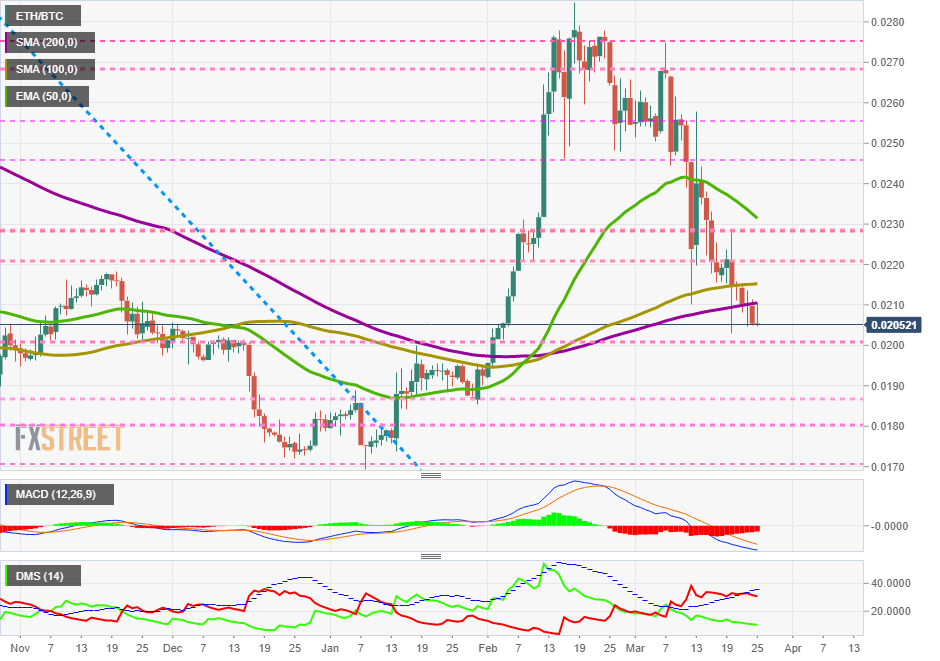
The MACD on the daily chart shows a relatively flat profile, while the moving averages are very close, making a bullish attempt possible in the next few days.
The DMI on the daily chart shows that the bears continue to lose strength, although the bulls do not take advantage of this weakness to increase their activity.
BTC/USD Daily Chart
The BTC/USD pair shows weakness at the start of the session and is unable to break the $6909 resistance level. The roof of the bullish channel is at only two resistance levels, a distance theoretically attainable for Bitcoin.
Above the current price, the first resistance level is at $6900, then the second at $7100 and the third one at $7150.
Below the current price, the first support level is at $6575, then the second at $6375 and the third one at $6250.
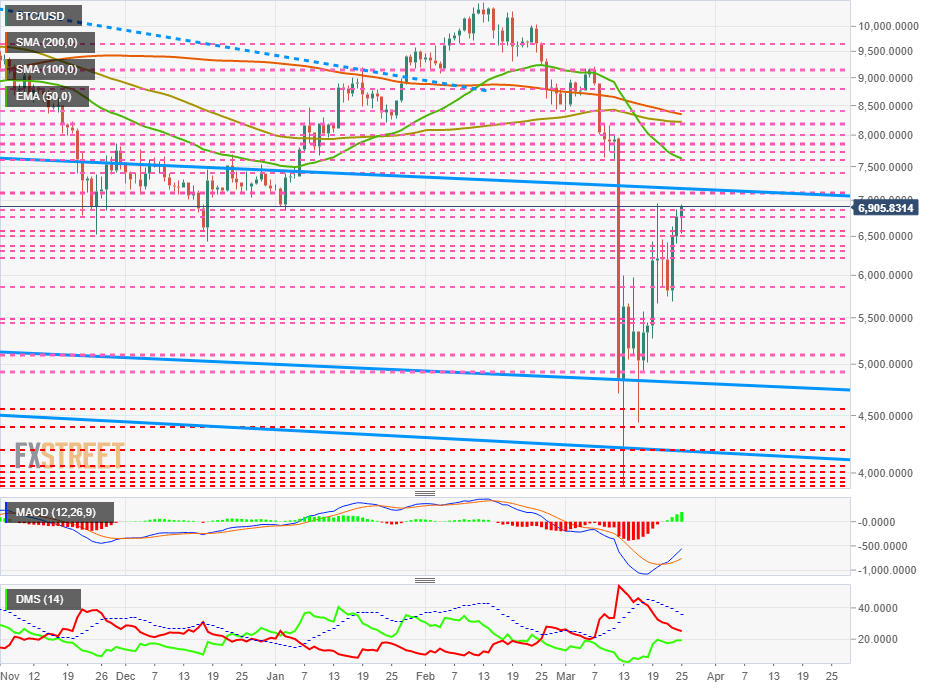
The MACD on the daily chart expands the bullish profile and the line separation. It is precisely the slightly exaggerated line separation that warns of a possible pause in the upward movement of the BTC/USD pair.
The DMI on the daily chart shows the two sides of the market moving nearby. The confrontation between bears and bulls seems to be close, which could also support a scenario of a pause in the bullish trend.
ETH/USD Daily Chart
The ETH/USD pair is currently trading at the price level of $141.6 and it is having trouble breaking out of the price congestion resistance level at $142.5.
Above the current price, the first resistance level is at $142.5, then the second at $150 and the third one at $155.
Below the current price, the first support level is at $130, then the second at $125 and the third one at $120.
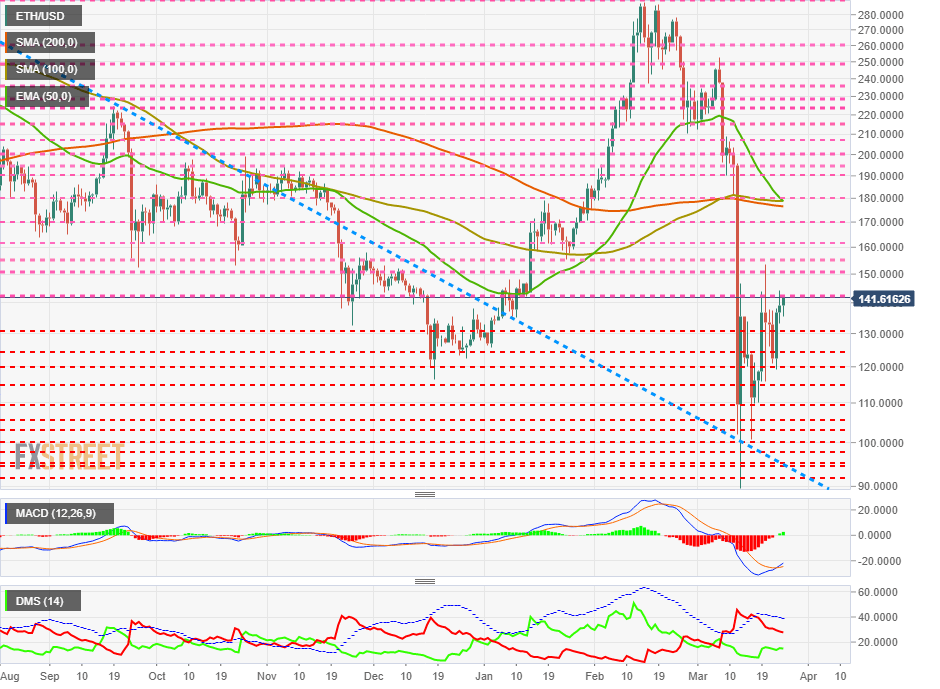
The MACD on the daily chart shows a completed bullish cross, although it is very recent and therefore still fragile.
The DMI on the daily chart shows the bears losing strength as the bulls gain strength. However, the distance between the two sides indicates that there won't be a confrontation between the two sides of the market for a few days.
XRP/USD Daily Chart
The XRP/USD pair is currently trading at the price level of $0.1649 and is the least performing member of the Top 3.
Above the current price, the first resistance level is at $0.165, then the second at $0.175 and the third one at $0.19.
Below the current price, the first level of support is at $0.15, then the second at $0.14 and the third one at $0.135.
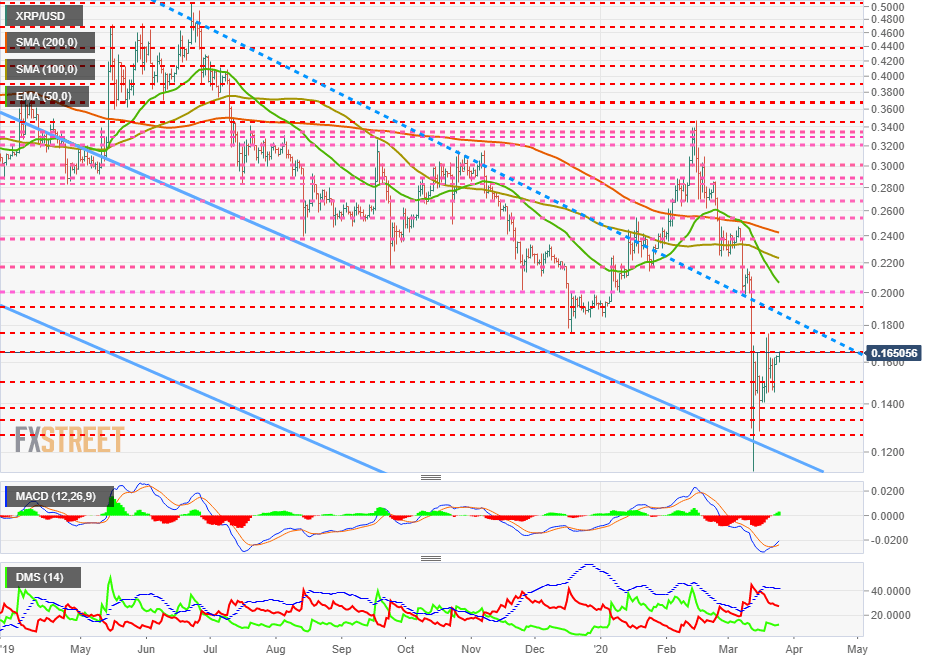
The MACD on the daily chart shows a full bullish cross but still not developed. The slope of the fast-moving average is higher than Ether so that we can see some upward volatility in XRP.
The DMI on the daily chart shows the bears are losing strength, but the bulls are not taking advantage of it and are giving up for the time being on the selling side of the market.
.
Get 24/7 Crypto updates in our social media channels: Give us a follow at @FXSCrypto and our FXStreet Crypto Trading Telegram channel
Author

Tomas Salles
FXStreet
Tomàs Sallés was born in Barcelona in 1972, he is a certified technical analyst after having completing specialized courses in Spain and Switzerland. He expanded his technical training following the guidance of great experts on the financial markets.


