Top 3 Price Prediction Bitcoin, Ether, Ripple: Bulls honing their antlers for an upward attempt ahead


  • The sense of extreme fear is divergent with the levels of the mathematical averages.
  • Bitcoin dominance ratio moves at a structural pivot level and can lead to a trend change.
  • XRP is the winner of the day, but far away from fleeing out of the bearish scenario that began in 2018.

The Crypto board dawns quietly, or at least that's what it looks like at first glance. While Bitcoin or Ether is still in the ranges of previous days, as we slide the crypto board, we see that in the Altcoin segment, there is significant buying activity. The beneficiaries of the growing buying interest are values within the Top 20 Altcoin, such as XRP, Ethereum Classic, Litecoin, Tron or Stellar Lumens.

The interrelationship between Bitcoin and the Altcoin segment favours the latter today, a situation that has not been the case for two weeks. The Bitcoin dominance chart shows how Wednesday impacted the SMA200 and how yesterday the dominance ratio was pushed down powerfully. The current level of Bitcoin dominance is essential from a technical point of view. This level, in the range of 67.5% Bitcoin dominance, acts as support and resistance six times in the last three years and always coincides with a critical moment in the crypto market.

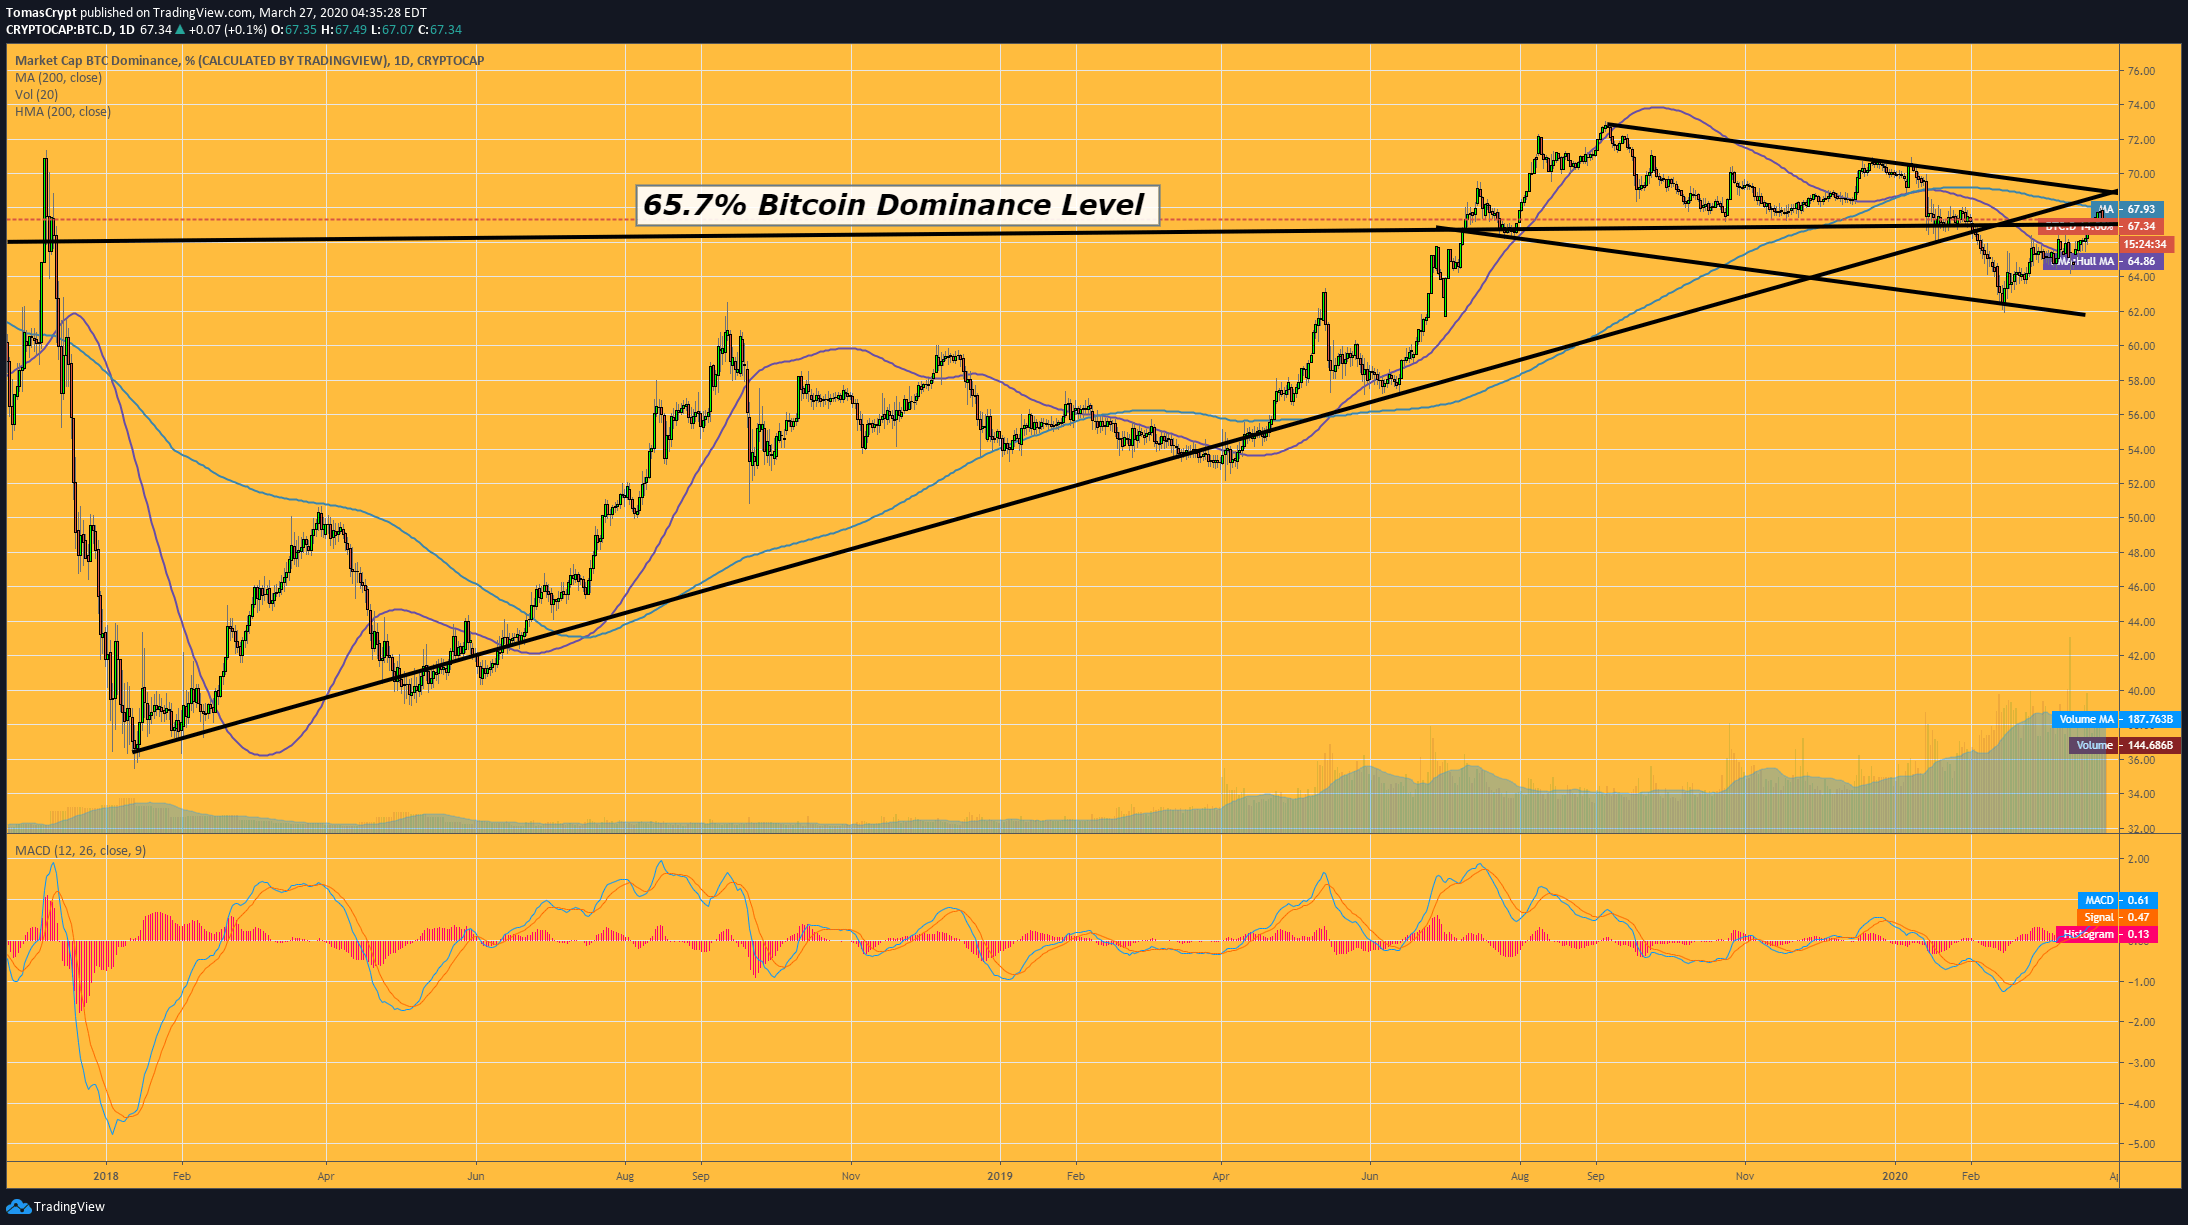
From this level of dominance began the downtrend that caused the pump of late 2017, and also this level stopped the recovery of the Bitcoin against Altcoins from the dump of early 2018 and extended until late 2019.


ETH/BTC Daily Chart

The ETH/BTC pair is currently trading at the 0.02045 price level and is holding at a low level near the major moving averages. In the next few days, we will likely see a move towards the 0.022/0.023 range.

Above the current price, the first resistance level is at 0.021, then the second at 0.022 and the third one at 0.023.

Below the current price, the first support level is at 0.020, then the second at 0.018 and the third one at 0.017.

The MACD on the daily chart shows a setup before a bullish cross attempt. We don't know if the fast average will manage to cross the signal line upwards, but we do know that it will try. 

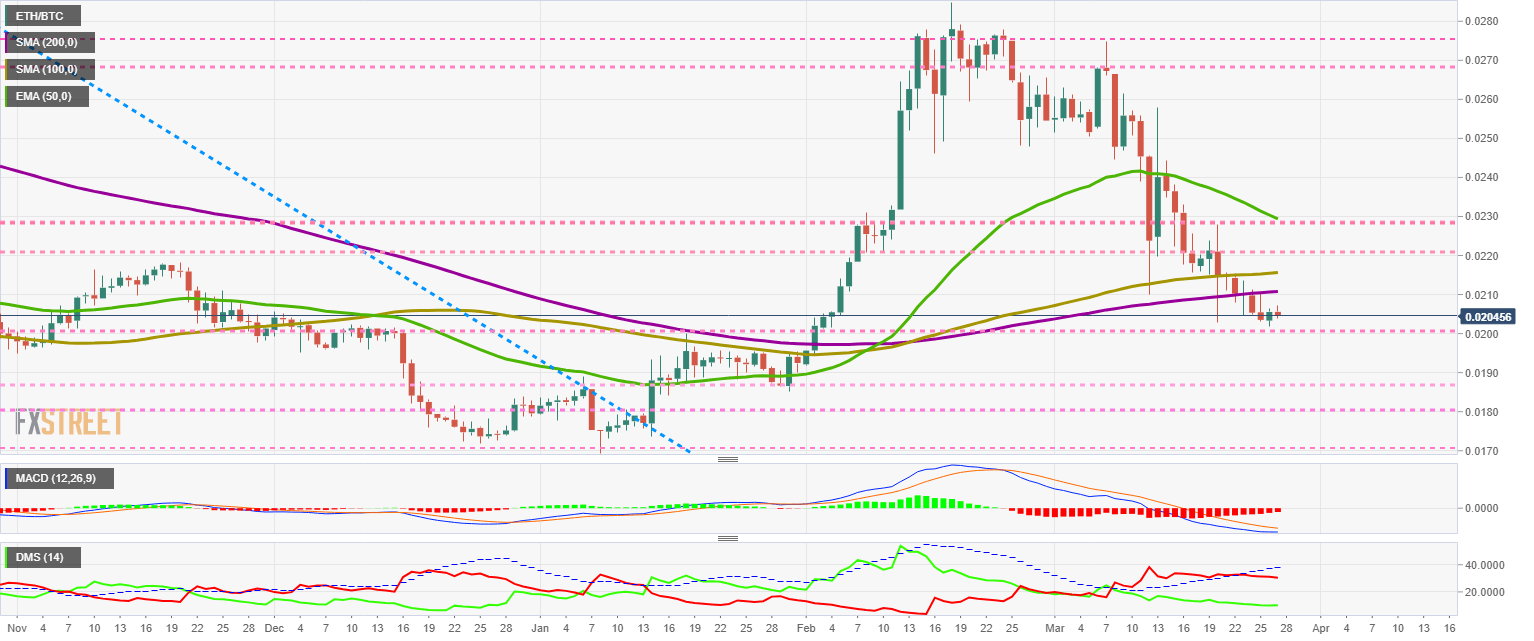
The DMI on the daily chart shows both bulls and bears seemingly numb. Both buyers and sellers are at the same level since the beginning of this week.


BTC/USD Daily Chart

The BTC/USD pair is currently trading at the price level of $6667, and it appears as if the price is consolidating before a long-term downward channel attack. The challenge is significant, as above the channel are the main moving averages acting as a second defensive wall. The BTC/USD pair has the potential for an upside price increase of 11.29%.

According to the MACD and DMI indicators, a significant attack could take place in the next few days. 

Above the current price, the first resistance level is at $6850, then the second at $7150 and the third one at $7500.

Below the current price, the first support level is at $6575, then the second at $6350 and the third one at $6250.

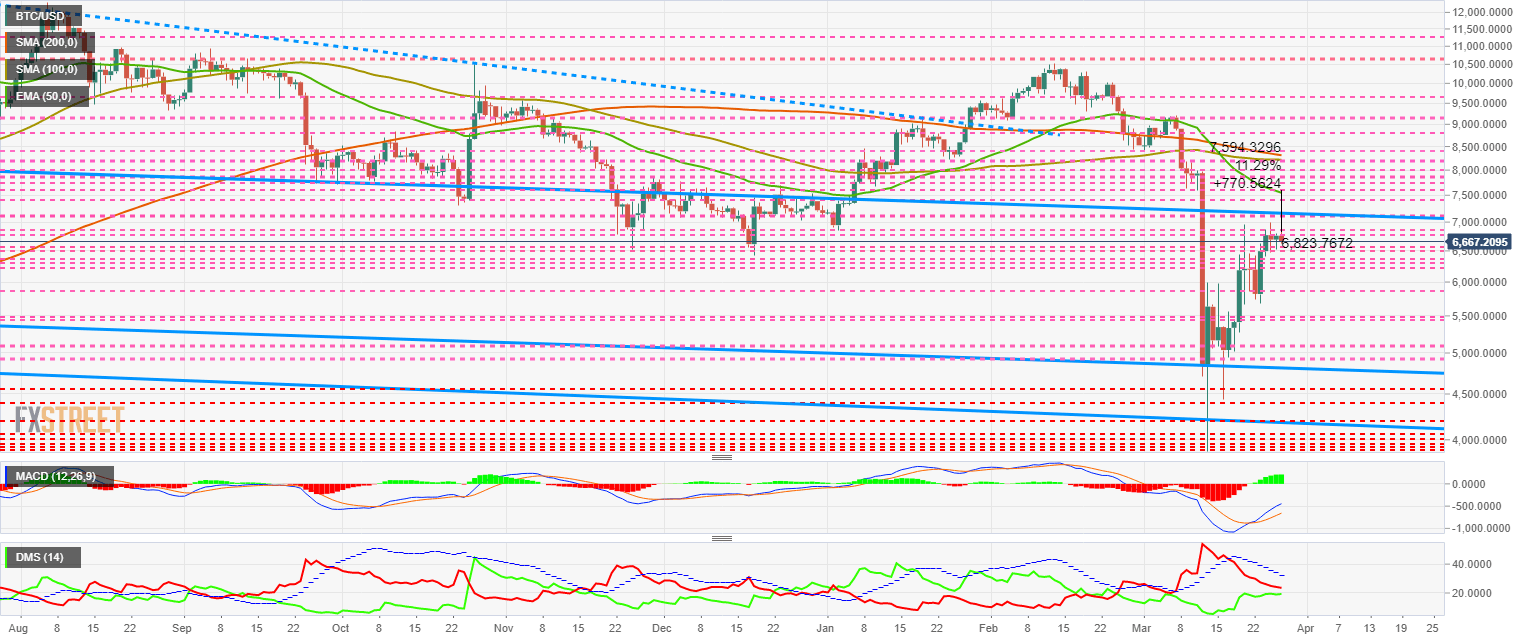
The MACD on the daily chart continues to show a strong slope and proper line spacing, which should be accompanied by a strong price increase. The current pause in the upward movement is divergent with the indicator's positioning.

The DMI on the daily chart shows that the bulls are already within striking distance of the bears, a confrontation that may occur soon. The current setup, with both sides of the market slowly approaching, usually leads to a breakout movement.


ETH/USD Daily Chart

The ETH/USD pair is currently trading at $136.2 and appears to be consolidating in anticipation of an attempt to break out of the $140 level. Above this resistance level, Ether has significant room to move up to the $175 level, a potential price increase of 22.48%. 

Above the current price, the first resistance level is at $140, then the second at $150 and the third one at $155.

Below the current price, the first support level is at $130, then the second at $125 and the third one at $120.

The MACD on the daily chart shows that the bullish cross is not developing actively. The upward slope is positive, but the opening between the lines is limited for now.

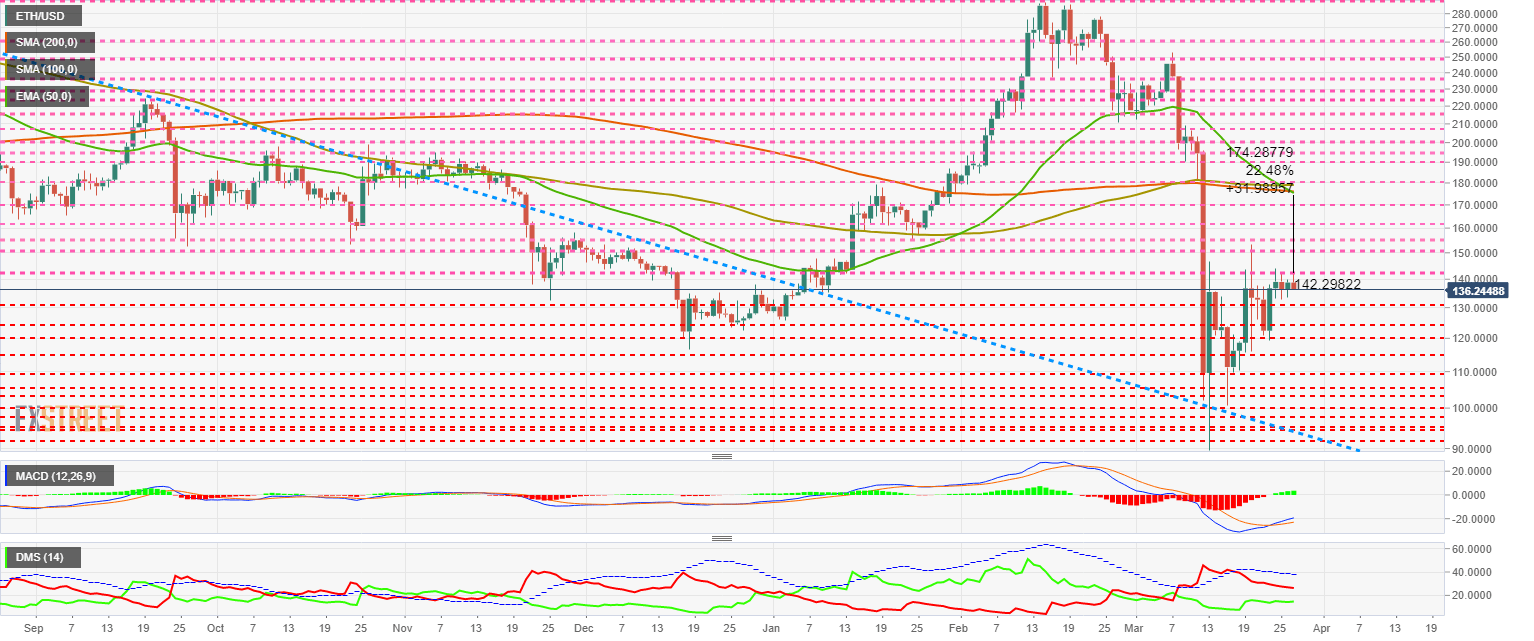
The DMI on the daily chart shows that the bears and bulls are slowly approaching the oversold region. The bears are helping the most in this approach by losing strength at a higher rate than the bulls.


XRP/USD Daily Chart

XRP was the winner of yesterday's session with a gain of over 6% and managed to break through the price congestion resistance at $0.17. Today the price is back down a bit and will try to consolidate the price level. XRP is only one degree away from the long term bearish channel ceiling. 

The Ripple token has not been able to break out of this bearish channel since December 2018, a very worrying situation.

Above the current price, the first resistance level is at $0.18, then the second at $0.19 and the third one at $0.20.

Below the current price, the first support level is at $0.17, then the second at $0.15 and the third one at $0.14.

The MACD on the daily chart shows a bullish cross forming. The MACD on the daily chart shows a developing bullish cross. The current setup should show a significant upward movement.

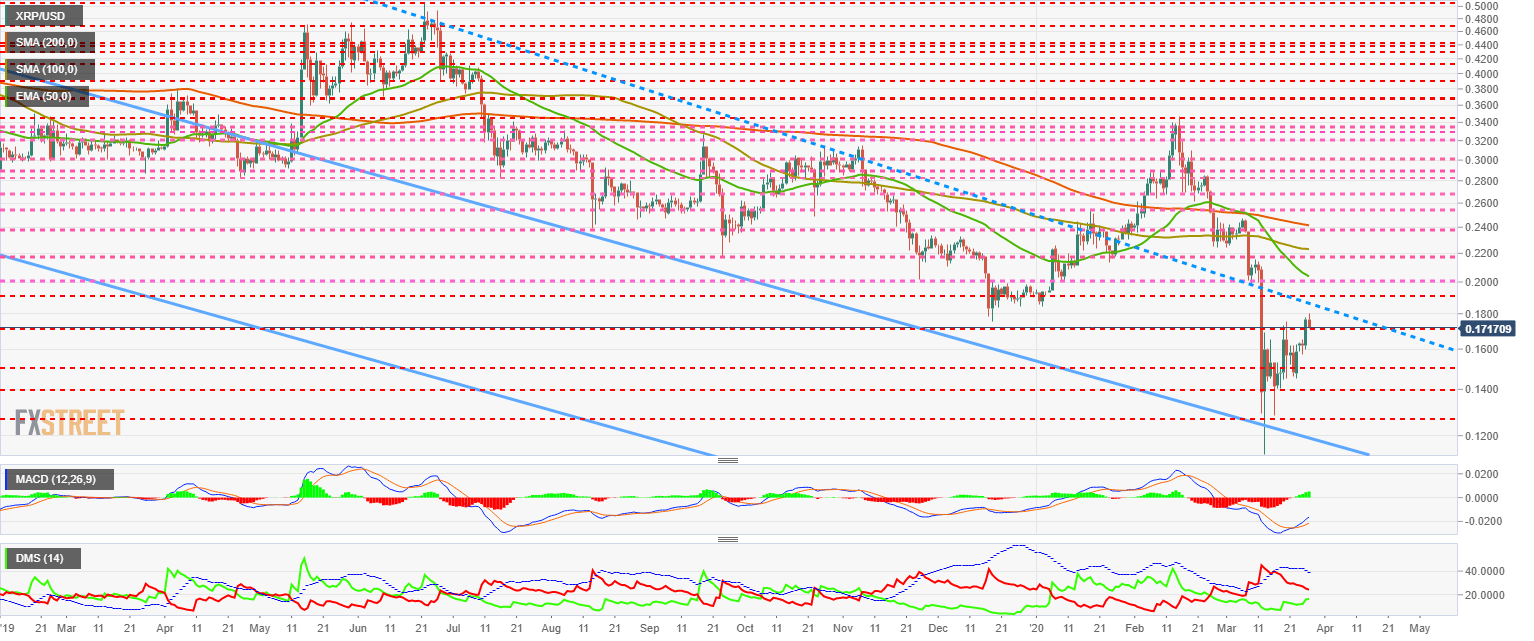
The DMI on the daily chart shows the bulls moving fast towards the bears. The selling side of the market seems to be unconvinced of its strength and is moving significantly lower.


Get 24/7 Crypto updates in our social media channels: Give us a follow at @FXSCrypto and our FXStreet Crypto Trading Telegram channel


Information on these pages contains forward-looking statements that involve risks and uncertainties. Markets and instruments profiled on this page are for informational purposes only and should not in any way come across as a recommendation to buy or sell in these assets. You should do your own thorough research before making any investment decisions. FXStreet does not in any way guarantee that this information is free from mistakes, errors, or material misstatements. It also does not guarantee that this information is of a timely nature. Investing in Open Markets involves a great deal of risk, including the loss of all or a portion of your investment, as well as emotional distress. All risks, losses and costs associated with investing, including total loss of principal, are your responsibility. The views and opinions expressed in this article are those of the authors and do not necessarily reflect the official policy or position of FXStreet nor its advertisers. The author will not be held responsible for information that is found at the end of links posted on this page.

If not otherwise explicitly mentioned in the body of the article, at the time of writing, the author has no position in any stock mentioned in this article and no business relationship with any company mentioned. The author has not received compensation for writing this article, other than from FXStreet.

FXStreet and the author do not provide personalized recommendations. The author makes no representations as to the accuracy, completeness, or suitability of this information. FXStreet and the author will not be liable for any errors, omissions or any losses, injuries or damages arising from this information and its display or use. Errors and omissions excepted.

The author and FXStreet are not registered investment advisors and nothing in this article is intended to be investment advice.

Join Telegram

Recommended content


Recommended Content

Editors’ Picks

SEC doubles down on TRON's Justin Sun lawsuit dismissing claims over jurisdiction

SEC doubles down on TRON's Justin Sun lawsuit dismissing claims over jurisdiction

The SEC says it has jurisdiction to bring Justin Sun to court as he traveled extensively to the US. Sun asked to dismiss the suit, arguing that the SEC was targeting actions taken outside the US.

More TRON News

XRP fails to break past $0.50, posting 20% weekly losses

XRP fails to break past $0.50, posting 20% weekly losses

XRP trades range-bound below $0.50 for a sixth consecutive day, accumulating 20% losses in the last seven days. Ripple is expected to file its response to the SEC’s remedies-related opening brief by April 22. 

More Ripple News

ImmutableX extends recovery despite $69 million IMX token unlock

ImmutableX extends recovery despite $69 million IMX token unlock

ImmutableX unlocked 34.19 million IMX tokens worth over $69 million early on Friday. IMX circulating supply increased over 2% following the unlock. The Layer 2 blockchain token’s price added nearly 3% to its value on April 19. 

More Cryptocurrencies News

Bitcoin Weekly Forecast: BTC post-halving rally could be partially priced in Premium

Bitcoin Weekly Forecast: BTC post-halving rally could be partially priced in

Bitcoin price briefly slipped below the $60,000 level for the last three days, attracting buyers in this area as the fourth BTC halving is due in a few hours. Is the halving priced in for Bitcoin? Or will the pioneer crypto note more gains in the coming days? 

More Bitcoin News

Bitcoin: BTC post-halving rally could be partially priced in Premium

Bitcoin: BTC post-halving rally could be partially priced in

Bitcoin (BTC) price briefly slipped below the $60,000 level for the last three days, attracting buyers in this area as the fourth BTC halving is due in a few hours. Is the halving priced in for Bitcoin? Or will the pioneer crypto note more gains in the coming days? 

Read full analysis

BTC

ETH

XRP