Top 3 Price Prediction Bitcoin, Ether, Ripple: Altcoin segment – “Houston, we have a problem”
- Bitcoin's dominance chart shows a key moment that can have disastrous consequences.
- An increase in King Bitcoin dominance could mean the end of hundreds of Altcoin projects.
- Main Altcoins show signs of a possible positive outcome, but everything is at stake.

The crypto ecosystem seems to be satisfied with the price increases that are taking place in the vast majority of crypto assets. Bitcoin reacted with a 10% price improvement, followed by Ether and already in today's Asian session by XRP.
This feeling remains in the headlines, as a more in-depth insight makes it clear that the crypto board will continue to be under stress as long as prices manage to escape the current bearish scenarios.
The reflection of this worrying situation is in the market sentiment measure published by alternative.me, which reaches level 12 – in other words, extreme fear.
One of the most apparent reasons to be concerned is the behaviour of the Bitcoin dominance chart. In my opinion, this graph is one of the critical indicators of the health of the crypto market. The other is the ETH/BTC chart.
The Bitcoin dominance chart shows how the king of cryptocurrencies has been regaining market share since the end of the bullish stretch that started in January (A). During February and early March, there were two attempts to recover the trend line (B).
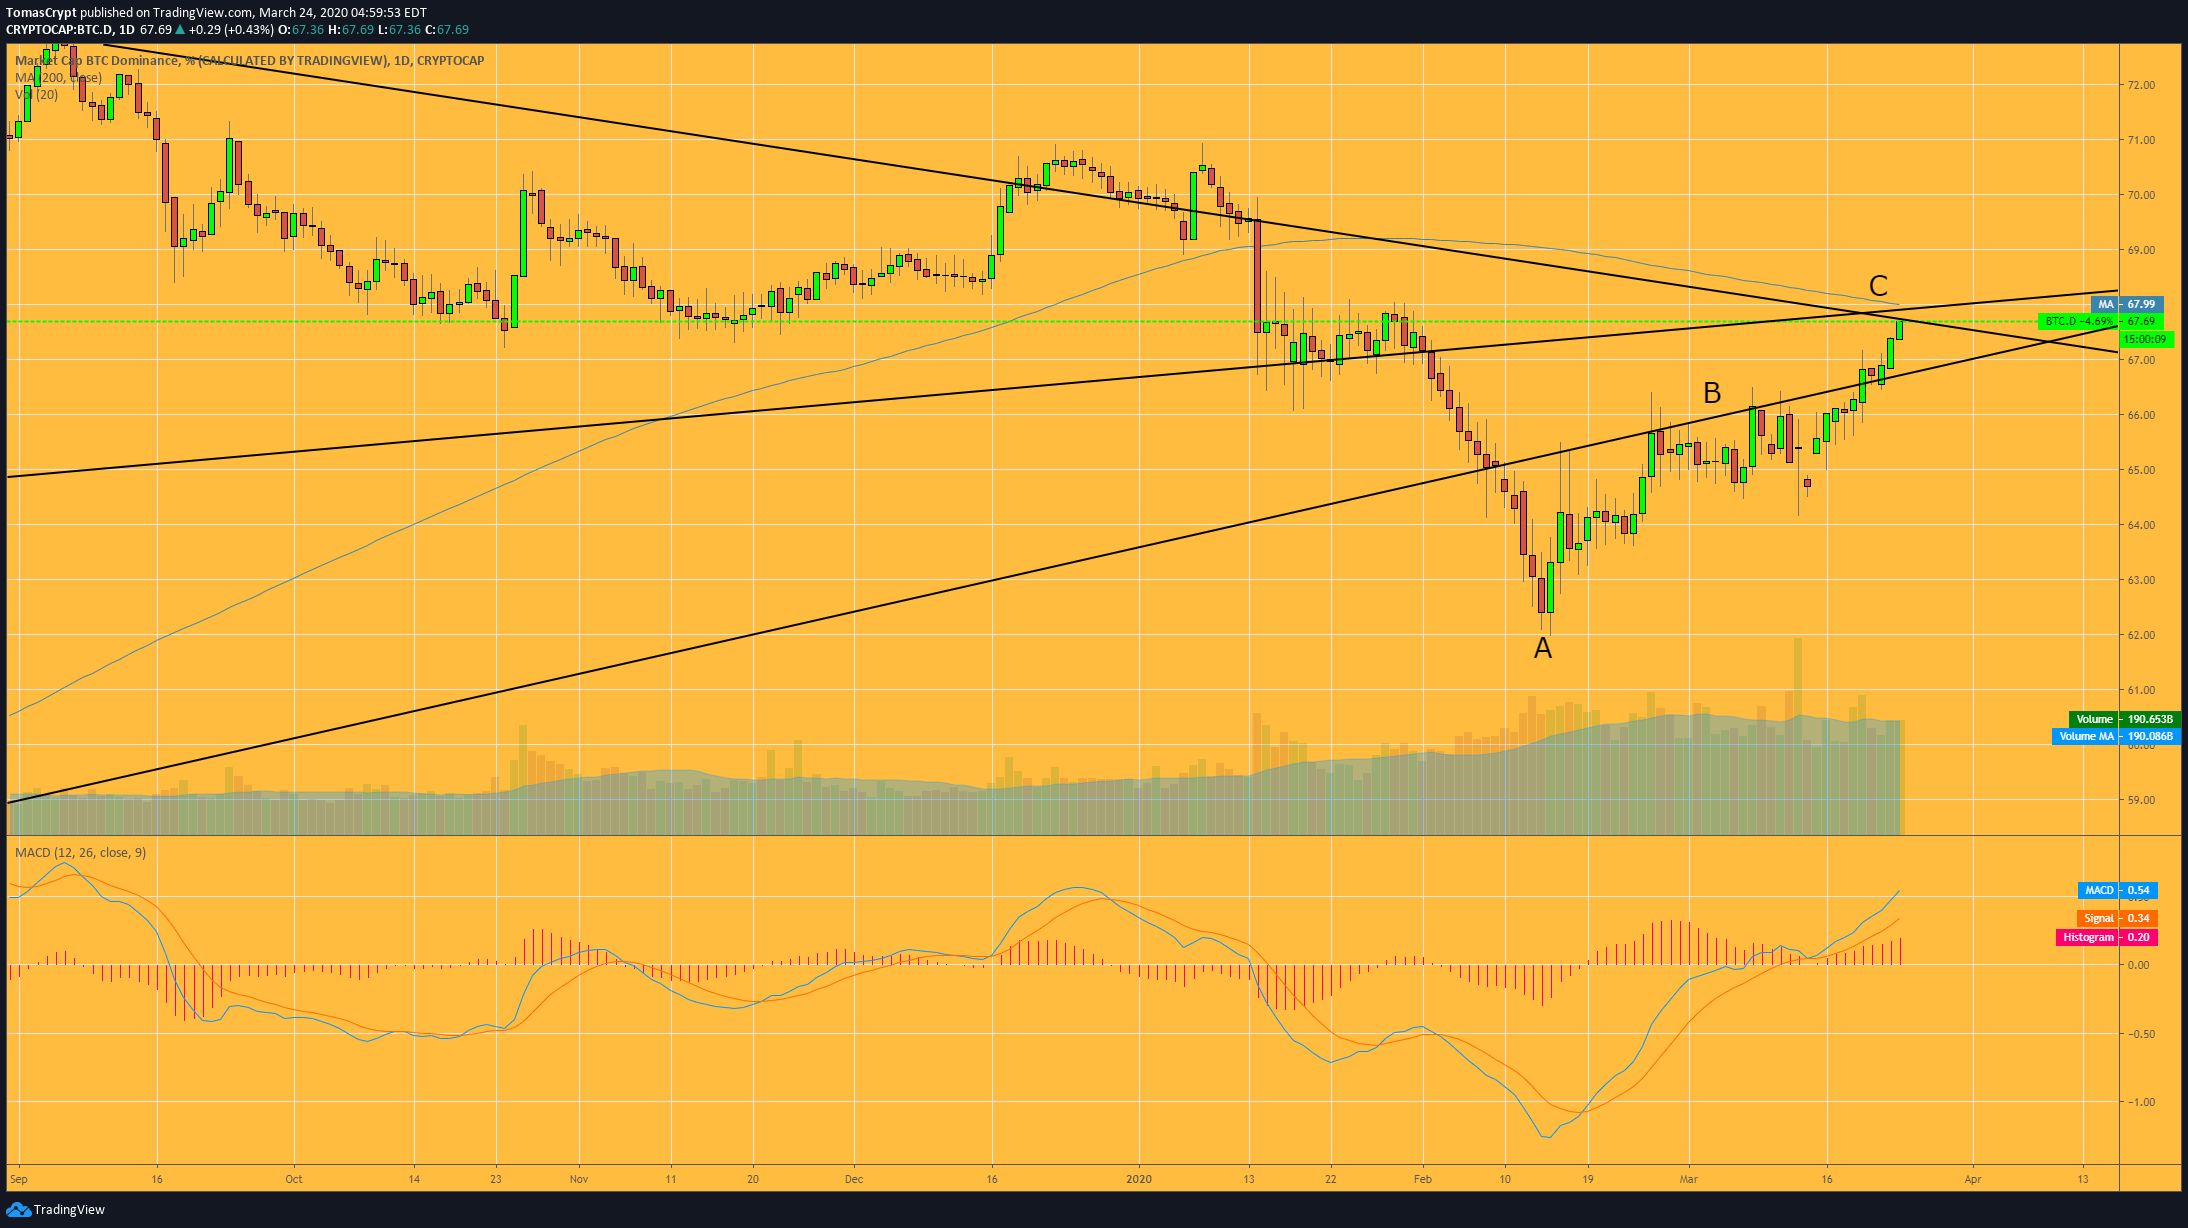
As you can see in the image below, the dominance indicator is located just below an essential technical junction, formed by two significant trend lines and also by the presence of the SMA200 (C). If the dominance level exceeds these obstacles, it will be favourable for the survival of Bitcoin. Still, it can drag the whole crypto segment into a critical situation that could end up with many projects.
A healthy market needs multiple investment options, and too much dominance of one endangers the rest.
If, on the other hand, Bitcoin's market share increase stops here, it could be the start of a recovery from the upward trend seen since the beginning of the year.
ETH/BTC Daily Chart
The ETH/BTC pair is currently trading at the price level of 0.0209 and is moving dangerously below the SMA200, reinforcing the momentum of the Bitcoin dominance chart.
Above the current price, the first resistance level is at the price level of 0.021, then the second at 0.022 and the third at 0.023.
Below the current price, the first support level is at 0.020, then the second at 0.0186 and the third one at 0.018.
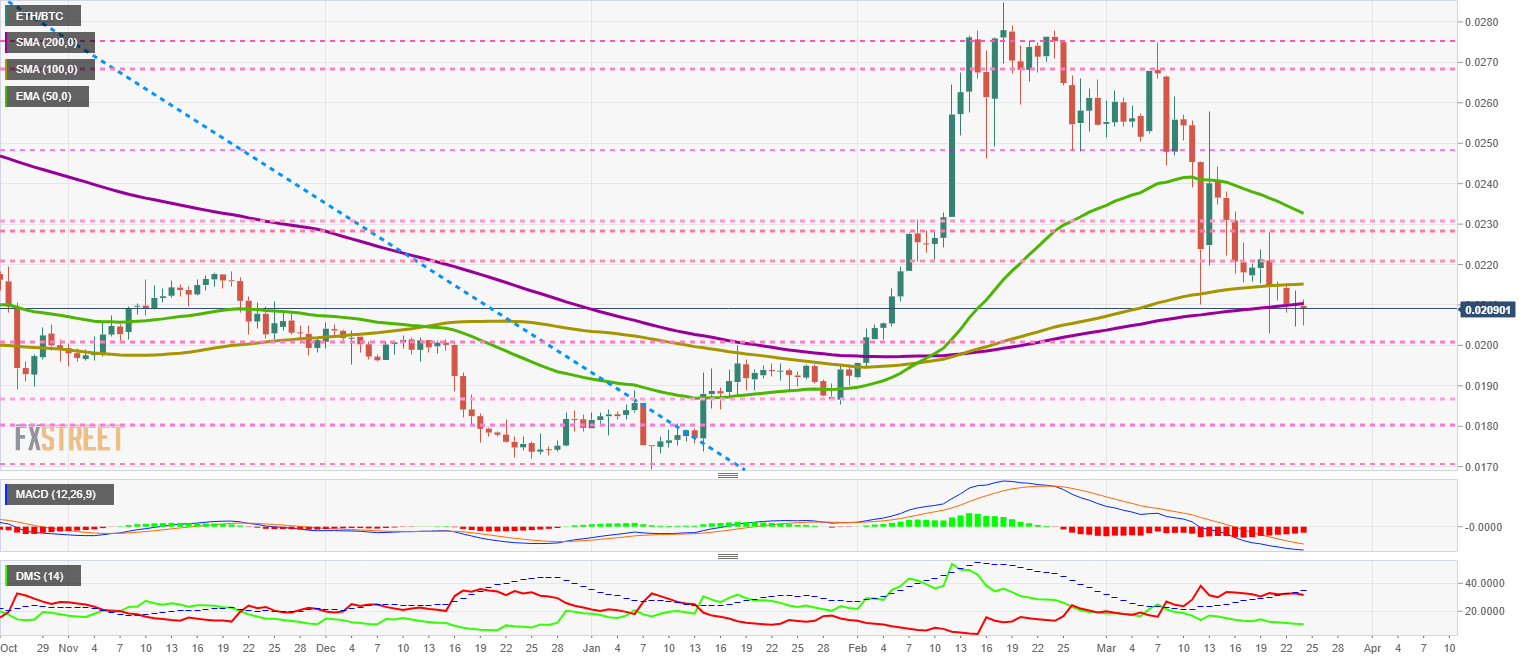
The MACD on the daily chart shows a decrease in the bearish momentum, with a flattening of the curve approaching a possible upward cross.
The DMI on the daily chart shows bears losing support from the ADX line, a sign of weakness that supports the momentum expressed by the MACD. The bulls do not see it the same way, and at the moment, they are not interested in challenging the bears for the lead.
BTC/USD Daily Chart
The BTC/USD pair is currently trading at the price level of $6708, trapped between price congestion support and resistance lines densely positioned on the chart.
Above the current price, the first resistance level is at $6825, then the second at $7000 and the third at $7175. Above this last resistance level, BTC/USD would again enter a favourable scenario in the medium term.
Below the current price, the first support level is at $6500, then the second at $6350 and the third one at $5850.
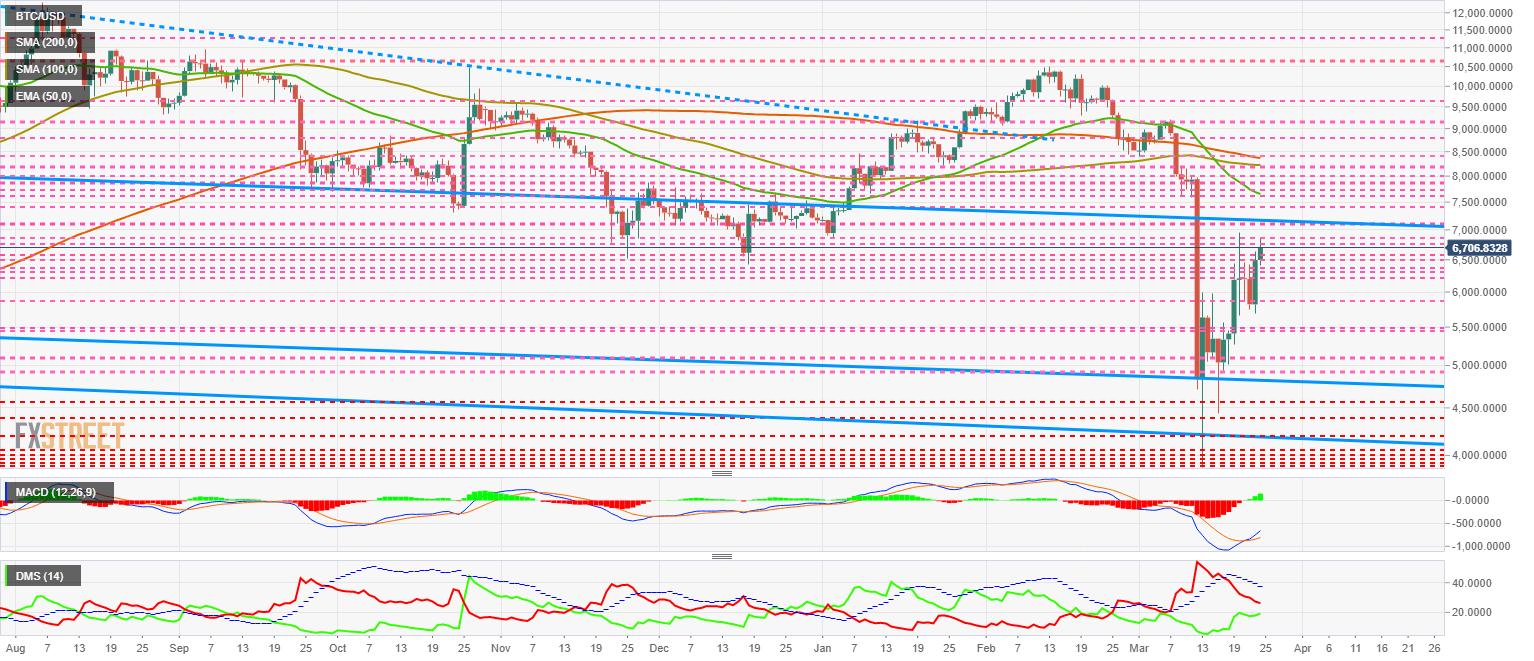
The MACD on the daily chart shows the development of the bullish cross that occurred at the end of last week. The slope is a bit too steep, so a slight drop in the price can be expected in the next few hours.
The DMI on the daily chart shows bears losing trend-line strength as the bulls are increasing it, another fact that reinforces the importance of the timing over the next few hours.
ETH/USD Daily Chart
The ETH/USD pair is currently trading at $140 and is slowing down sharply after yesterday's gains. The relative technical simplicity of the Ether chart gives an idea of how dependent it is on what Bitcoin is doing.
The first resistance level is at $145, then the second at $150 and the third one at $155.
Below the current price, the first support level is at $135, then the second at $130 and the third one at $125.
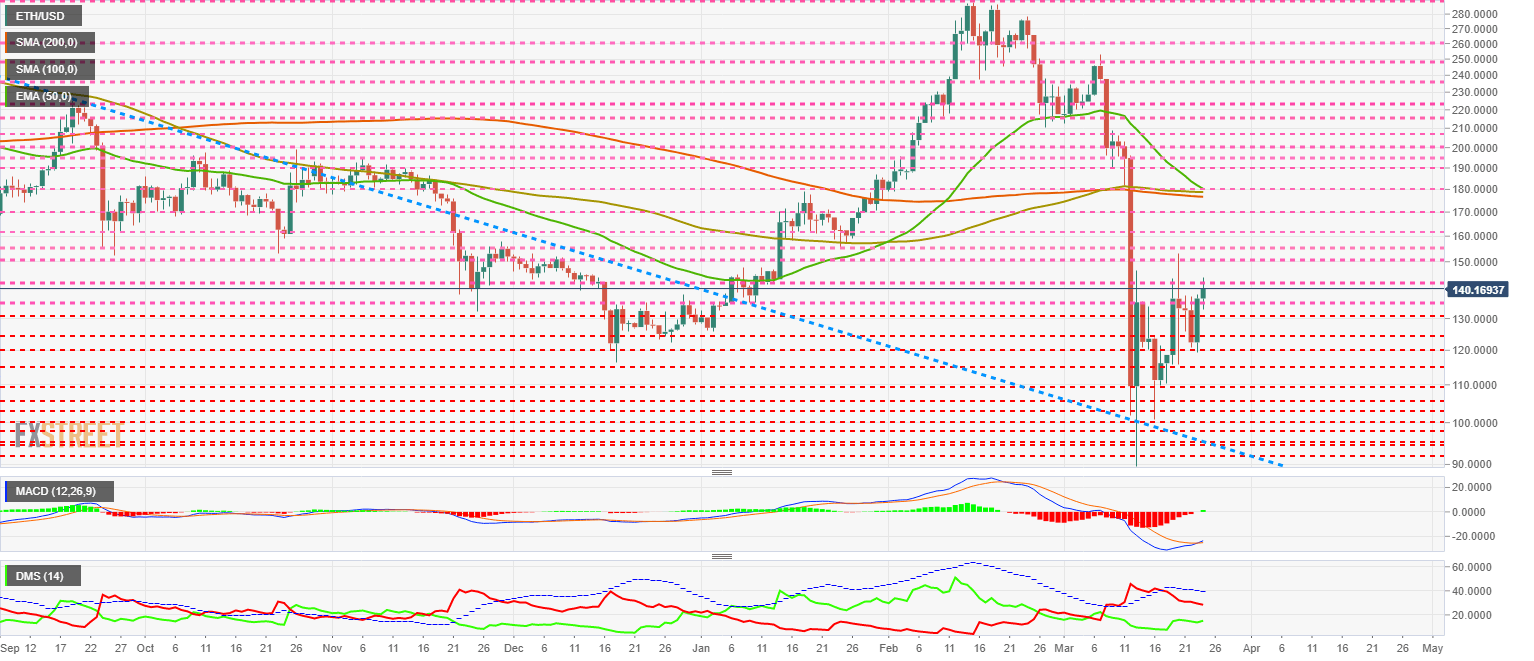
The DMI on the daily chart shows that the bears are losing trend strength but without excessive competition from the bulls.
XRP/USD Daily Chart
The XRP/USD pair is currently trading at a price level of $0.158 and is unable to exit the consolidation zone it began building last week.
Above the current price, the first resistance level is at $0.171, then the second at $0.19 and the third one at $0.20.
Below the current price, the first support level is at $0.15, then the second at $0.14 and the third one at $0.13.
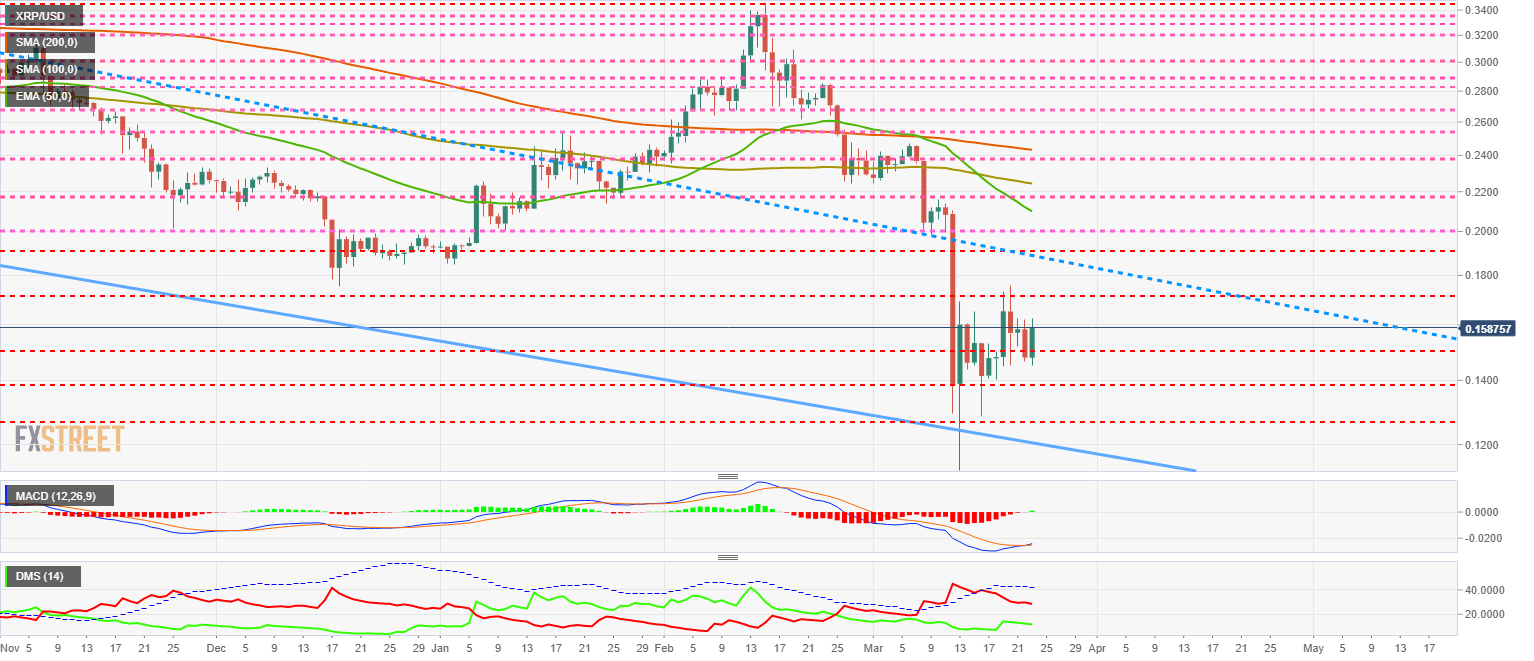
The MACD on the daily chart shows a bullish cross developing, which would support a positive outcome for the Altcoin segment of the event on the Bitcoin dominance chart.
The DMI on the daily chart shows the bears are losing traction, while the bulls are also dropping a bit. The buy-side shows a lack of confidence in the short term.
Get 24/7 Crypto updates in our social media channels: Give us a follow at @FXSCrypto and our FXStreet Crypto Trading Telegram channel
Author

Tomas Salles
FXStreet
Tomàs Sallés was born in Barcelona in 1972, he is a certified technical analyst after having completing specialized courses in Spain and Switzerland. He expanded his technical training following the guidance of great experts on the financial markets.


