Top 3 Price Forecast - Bitcoin, Ethereum, Ripple: Downward movements disguise a change in leadership
- Ethereum’s outperformance of its peers is positive for the market.
- Ripple shows strength and holds up well against market pessimism.
- Bitcoin pays dearly for its passivity during the previous bullish moment.

The Crypto market continues to move downward as a whole. This scenario of weakness will extend over the next few days.
If volatility does not increase, it is essential that falls are significant. However, you have to be careful because if the speed of the price accelerates the falls can get worse.
The ETH/USD chart in the weekly range indicates that prices will tend to rise in the medium term. In the short-term, some obstacles would technically lead to strong downward rejection movements. Also, according to this analysis, the turning point will occur in approximately two weeks.
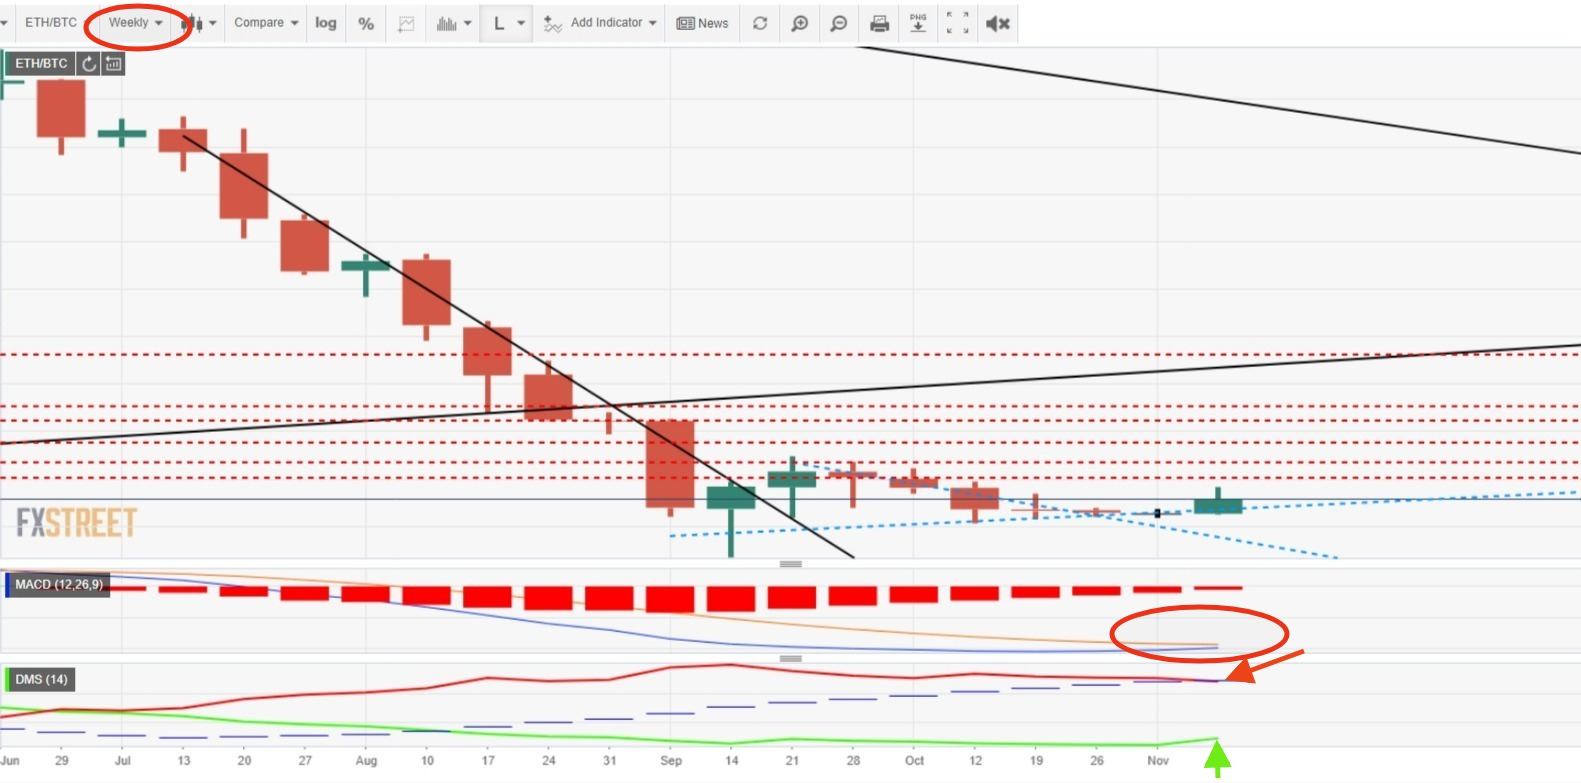
As we will see in the detailed analysis, Ethereum is better placed than Bitcoin to cope with falls.
Today it is also interesting to note how more and more countries are establishing specific taxes on Cryptocurrencies operations. The last case in France, which has created a tax rate of 30%. Taking this factor into account strengthens the assessment that the turning point will occur in approximately two weeks.
Do you want to know more about my technical setup?
BTC/USD 240-Minutes.
At this time the BTC/USD trades at the price level of $6.341, dropping 1.01% on the day.
Below the current price, there is only one price level to look at. This support level is at $6,300, where the price congestion level meets a bullish trend line from October’s lows.
If the BTC/USD breaks this support, all gains will be lost and we will enter a new bearish phase in the medium term. As for the price target, it would set $4,500 as a reasonable target. This situation would repeat the structure already given in 2014 that gave way to a long-term bullish trend.
Above the current price, the first resistance in the moving averages zone is at $6,400. The second price zone to conquer is $6,550 that would open a new upward scenario with a price target above $6,900.
-636773584251406534.png&w=1536&q=95)
The MACD at 240-Minutes continues to cross down but above the zero line. This situation provides some bullish support, but we cannot rule out a downward break.
The DMI at 240-Minutes shows us how the bears are above the bulls, which are losing momentum significantly. Both sides are below the ADX line, a situation conducive to violent changes of direction.
ETH/USD 240-Minutes.
The ETH/USD is currently trading at the $209.8 price level, suffering a 0.62% drop from yesterday's close.
Below the current price level, the ETH/USD has all moving averages as support lines and with some distance between them. This situation is the big difference from the BTC/USD situation. The first support is at $209.4 (EMA50). The second support level is $206.4 (SMA200 and support by price congestion). The third support level at $204.23 (SMA100).
Above the current price, the first resistance is at $215 (price congestion resistance). The second resistance is at $224 (price congestion resistance). Exceeding this price level would reinforce the bullish movement. The third level of upward resistance awaits $236 (price congestion resistance).
-636773585165809639.png&w=1536&q=95)
The MACD at 240-Minutes shows a cross profile on the downside but above the zero line. This line can support the price when the indicator reaches the equilibrium zone.
The 240-Minute DMI shows a situation of total equality between bears and bulls. Unlike the BTC/USD, here it is still not clear who will take the lead.
XRP/USD 240-Minutes.
The XRP/USD is quoted at $0.504 at the time of writing. Its structure shows much more solidity than Bitcoin or Ethereum.
Below the current price, the first support is at $0.494 (EMA50). The second support awaits at $0.474 (Trendline). This second level of support should not be broken down. The third support at $0.471 (SMA100). This moving average of 100 periods, is inclined to the rise and should surpass the trend line mentioned in the next few hours. This situation would bring even more strength to the XRP/USD.
Above the current price, the first resistance at $0.55 (price congestion resistance). The second resistance is at $0.585 (price congestion resistance). The target for a new bullish tranche is above the last relative maximum of $0.764.
-636773585980501744.png&w=1536&q=95)
The MACD at 240-Minutes is crossed down but above the zero line. It has room to continue falling until it finds support at the equilibrium level of the indicator.
The 240-Minute DMI shows us that bears and bulls fully matched. Both are below the ADX line, which facilitates abrupt changes of direction.
Get 24/7 Crypto updates in our social media channels: Give us a follow at @FXSCrypto and our FXStreet Crypto Trading Telegram channel
Author

Tomas Salles
FXStreet
Tomàs Sallés was born in Barcelona in 1972, he is a certified technical analyst after having completing specialized courses in Spain and Switzerland.


