Top 3 meme coins: Dogecoin, Shiba Inu, and Pepe – DOGE, SHIB and PEPE stabilize around key levels
- Dogecoin price retests its key support level at $0.22, with recovery on the cards.
- Shiba Inu price rebounds after finding support around its 50-day EMA, hinting at a short-term recovery.
- Pepe momentum indicators display bearish divergences, indicating a potential trend reversal.

Dogecoin (DOGE) and Shiba Inu (SHIB) prices are finding support around their key levels on Thursday, eyeing a short-term recovery. Meanwhile, Pepe (PEPE) displays a bearish divergence on the momentum indicators, indicating a potential trend reversal.
Dogecoin could recover if its 200-day EMA remains strong
Dogecoin price retested and stabilized around its 200-day Exponential Moving Average (EMA) at $0.21 multiple times this week. The 200-day EMA roughly coincides with the daily support level at $0.22, making this a key area of support. At the time of writing on Thursday, it rebounds slightly after retesting this support level.
Sideline investors looking for buy opportunities could do so at its 200-day EMA at $0.21.
If the 200-day EMA remains strong, DOGE could extend the recovery by 17% from its current level to retest its upper trendline boundary at around $0.26.
The Relative Strength Index (RSI) on the daily chart reads 55, rebounding from its neutral level of 50 and pointing upward, indicating bullish momentum is gaining some traction.
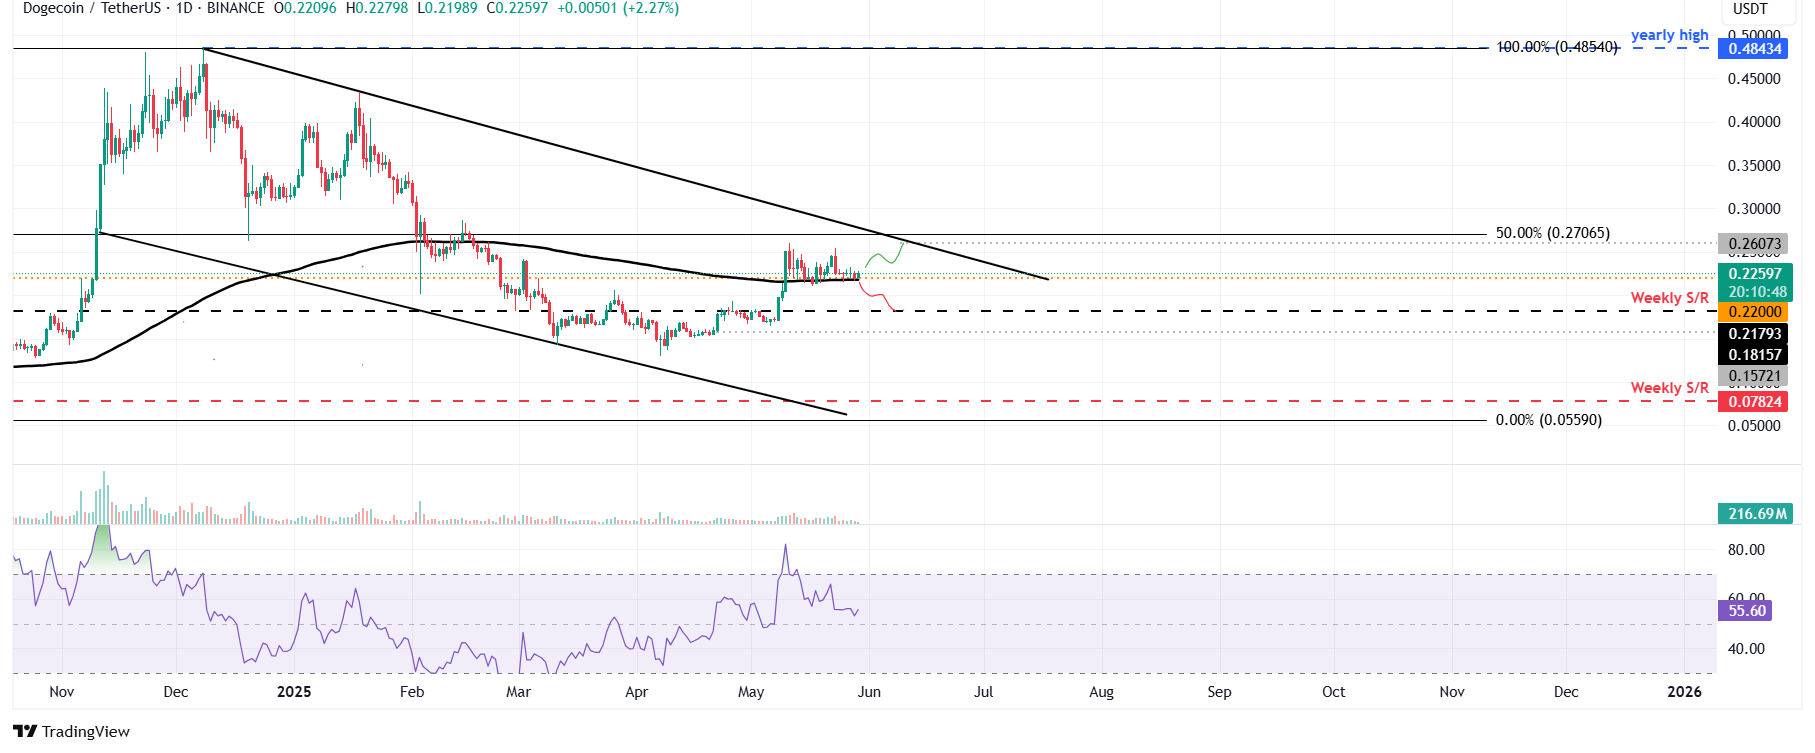
DOGE/USDT daily chart
However, if Doge breaks and closes below its 200-day EMA at $0.21, it could extend the decline to retest its next weekly support at $0.18.
Shiba Inu consolidates around key level, a recovery is on the cards
Shiba Inu price retested and found support around its 50-day EMA at $0.0000141 on Saturday and has been consolidating around this level. The 50-day EMA coincides with the daily support and the previously broken descending trendline, making this an important support level. At the time of writing on Thursday, it recovers slightly after retesting the 50-day EMA.
Sideline investors looking for short-term buy opportunities could do so at its current level of $0.0000145.
If the 50-day EMA continues to hold as support, SHIB could extend its recovery by 14% from its current level, potentially retesting its May 14 high of $0.0000167.
The RSI on the daily chart reads 51 and points upward after flattening around its neutral level of 50, indicating bullish momentum is gaining traction.
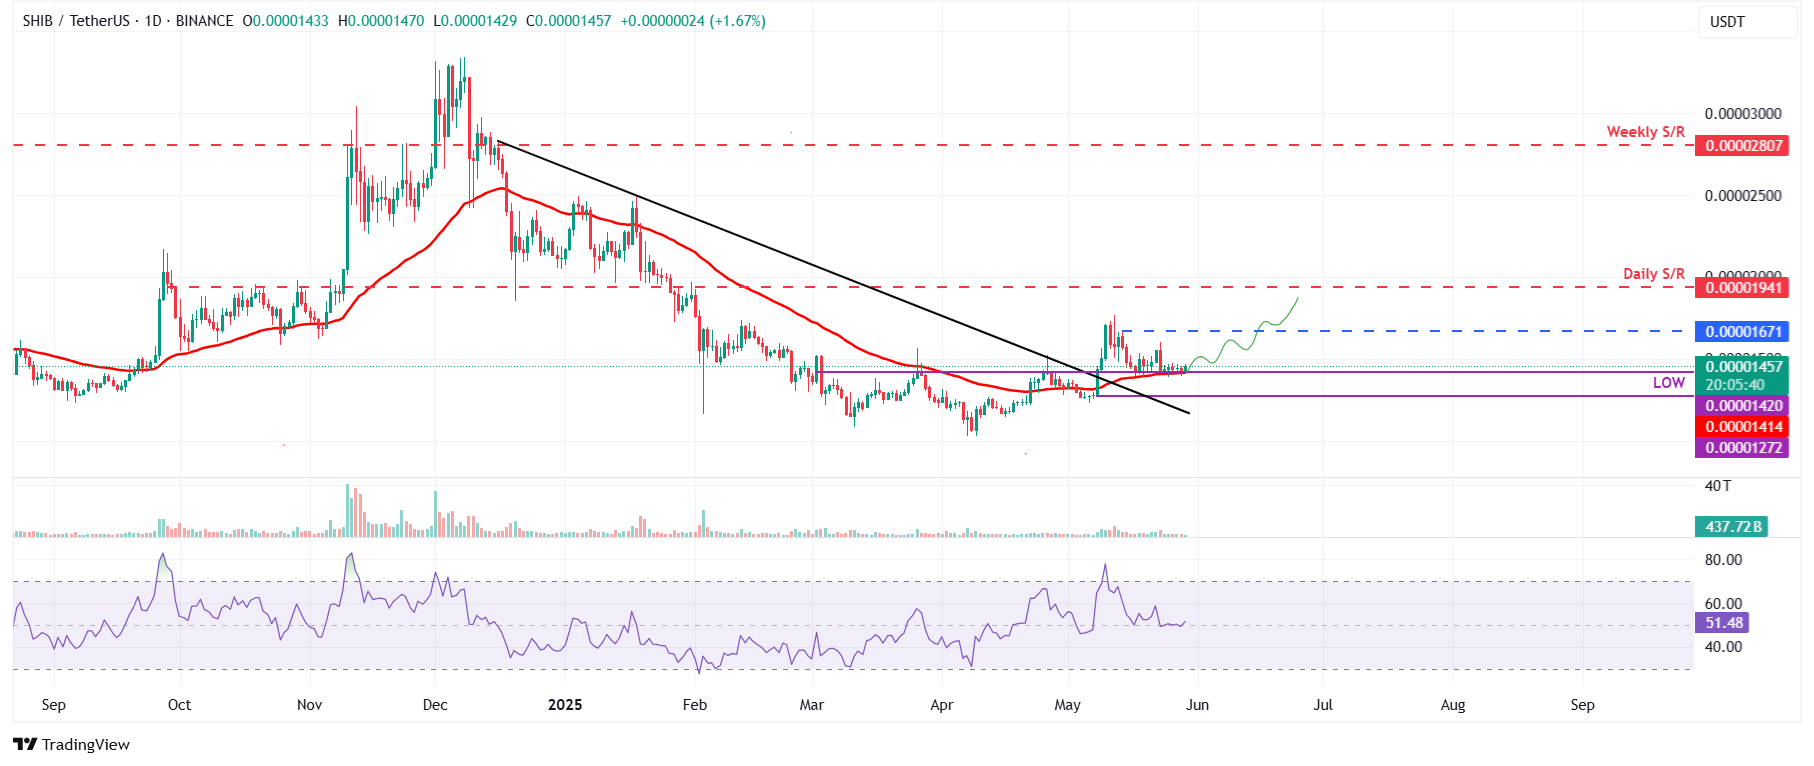
SHIB/USDT daily chart
On the other hand, if SHIB closes below the $0.0000141 support level, it could extend the decline to revisit its low of $0.0000127.
Pepe shows weakness in momentum indicators
Pepe price faced rejection around its daily level at $0.000016 last week and declined by 12.19% until Sunday. It recovered slightly at the start of the week. However, PEPE consolidated around the $0.0000136 level for the next three days. At the time of writing on Thursday, it recovers slightly, trading around $0.0000146.
The Relative Strength Index (RSI) indicator reflects weakness in momentum on the daily chart. The higher high in the frog-theme meme coin, which formed on May 23, does not align with the RSI's lower high for the same period. This development is referred to as a bearish divergence, which often signals a trend reversal or a short-term pullback. Moreover, the Moving Average Convergence Divergence (MACD) indicator also displayed a bearish crossover, indicating a potential sell signal and a correction ahead.
Sideline investors looking for sell opportunities could do so at its current level of $0.0000146.
If Pepe faces a correction, it could extend the decline to retest its next daily support at $0.0000121. Any follow-through selling below this level could trigger a drop to $0.0000107, its 100-day exponential moving average (EMA).
The bearish outlook for the Pepe meme coin remains in place, as the price is currently below the key daily resistance level at $0.000016 on the daily chart. A close above this level would invalidate the bearish thesis.
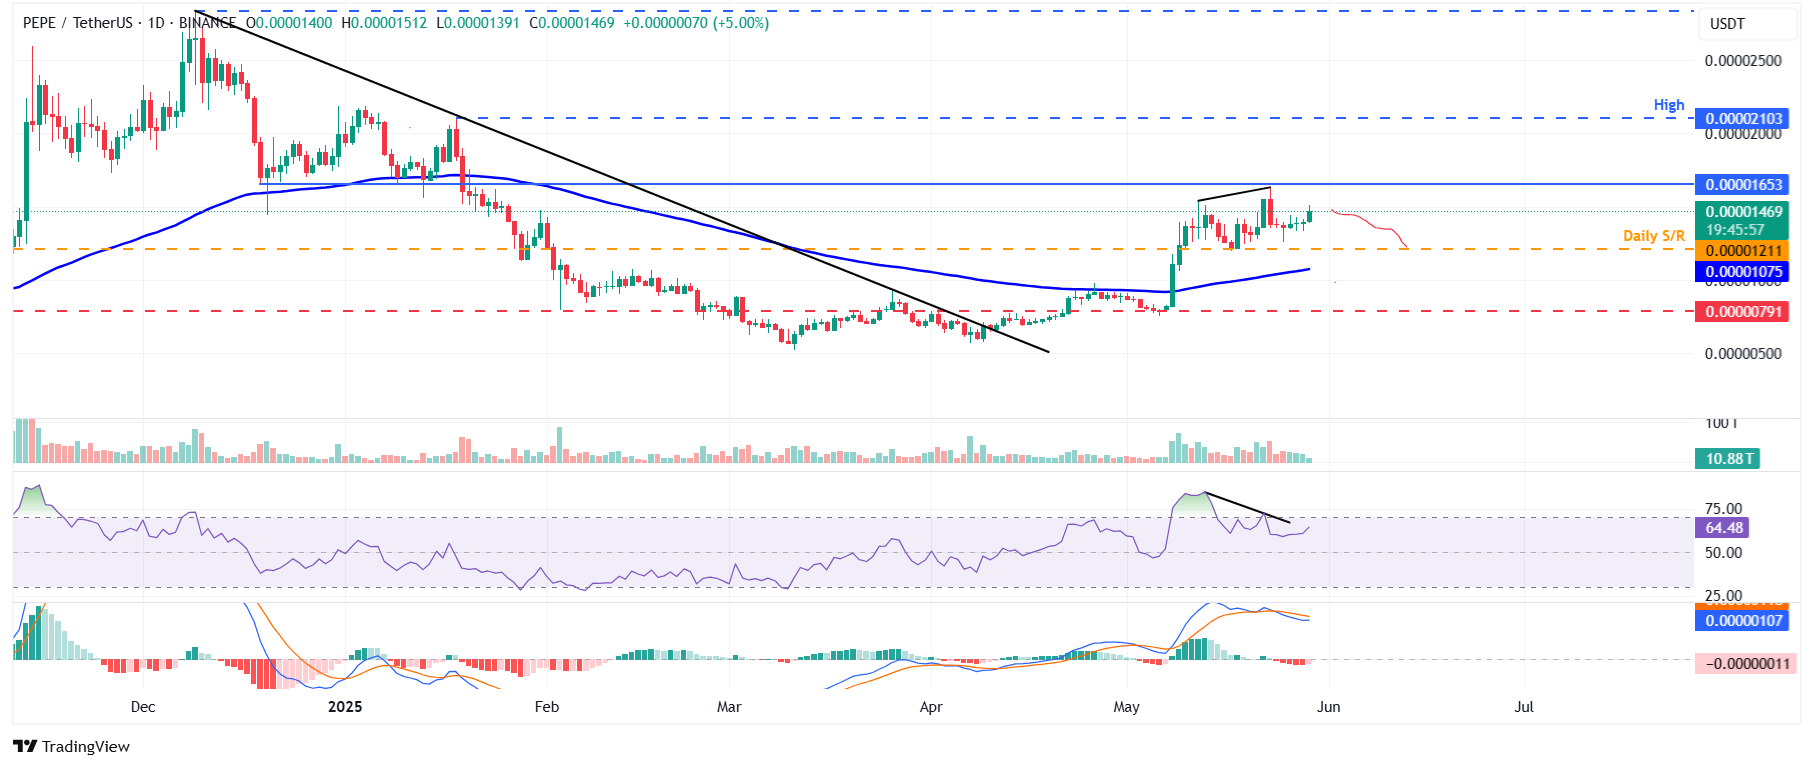
PEPE/USDT daily chart
Author

Manish Chhetri
FXStreet
Manish Chhetri is a crypto specialist with over four years of experience in the cryptocurrency industry.


