Top 3 - Bitcoin, Ripple & Ethereum price prediction: Consolidation levels on the positive side
- A bullish ride in the midst of the American session took the main Cryptocurrencies to the positive side of the charts
- A cluster of resistances toughens a quick resolution of the current price action

Two consecutive positive days have taken the main Cryptocurrencies to optimal areas where they now await patiently the moment to look for superior levels. The bullish path is complicated due to important moving averages and multiple resistances being on the way, while the supports below the current price are more spread out, bringing some risk to the bulls.
BTC/USD 4H chart
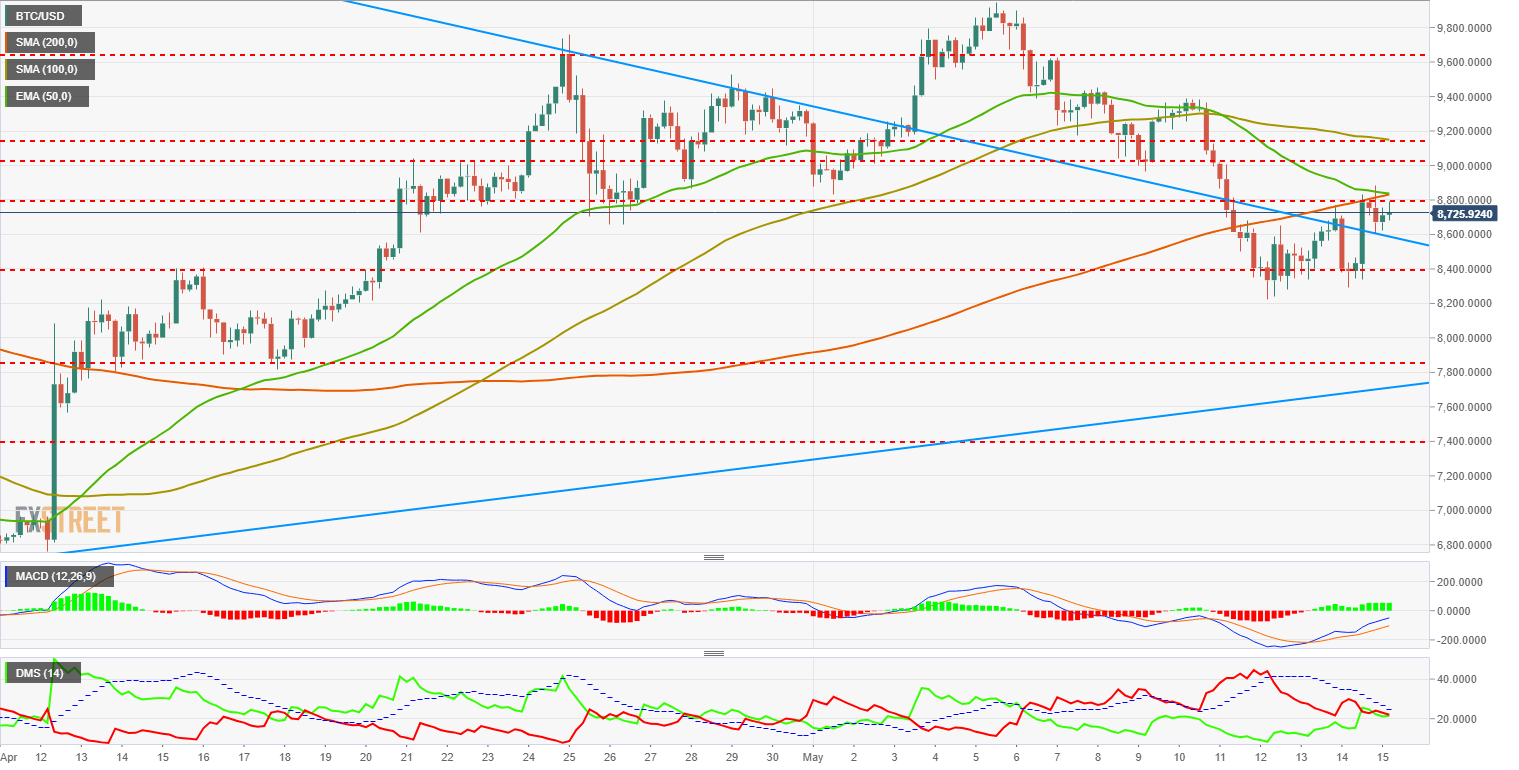
Bitcoin covered in just one period (4 hours) the distance between yesterday's support and today's resistance. BTC/USD reached the $8886 level, but has not been able to consolidate it. Bitcoin has been able to test and consolidate the diamond trendline that had been in play from last April 24th, though.
This price area has a strong congestion, with a big number of resistances and key technical levels that complicate the path for the bulls. The first resistance for BTC/USD is just above the current price, at $8796, followed by the confluence of the 200-SMA and the 50-EMA in the $8832-$8836 area. If that zone is broken, the Bitcoin price will immediately find resistances at $9021 and at $9153, where the 100-SMA and a price resistance now await. As we can see, the Bitcoin bulls' journey is full of challenges.
On the other side, the main support is at $8400, followed by a secondary support in the $8200. Below there, nothing more until $7845. This structure is weakening the position of Bitcoin, as in case of a bullish breakout failure, the fall might be quick and considerably big.
MACD in the Bitcoin 4-hour chart is continuing its path down towards the 0 line, coming from the downside. The opening and inclination are adequate for a bullish continuation, although being so close to the medium line will involve a halt of the current bullish development.
Directional Movement Index in the same chart shows an equilibrium point between the buying and selling forces. ADX is falling strongly, which clearly reflects the current lack of trend strength. The resolution of the current tie between buyers and sellers will certainly be meaningful.
ETH/USD 4H chart
-636619729849811764.png)
Ethereum is living in its particular scenario, a lot more favorable to the bulls, that should find less barriers, as ETH/USD is trading above the moving averages, with less resistances on its way. That said, Ethereum is following the general market behavior and now rests above $726, the resistance broken yesterday during the American session. Above there, next resistance is at $756, with no more meaningful barriers until the $812 mark.
ETH is diverging from BTC also in the support side, where there are plenty of levels to protect the current bullish bias. The 100-SMA and the 50-EMA are trading between the $723 and the $716 mark. If that were not enough, a mid-term trendline is also meeting the $718 level. If those levels were lost, next supports would be at $695 and $680, although that last one lacks some strength.
MACD in the Ethereum 4-hour chart is trading above the current equilibrium level, proposing a lateral-bearish development that might try to confirm the cross to then continue to the upside.
Directional Movement Index in the same chart is showing a very similar profile to the Bitcoin one, although the ADX has fallen much more in this one, supporting the possibility of some lateral action for a brief period.
XRP/USD 4H chart
-636619730153881597.png)
Ripple reached yesterday the 50-EMA at $0.75. XRP/USD tried for two times to break above that barrier, but it failed both of them. Ripple did succeed to break the $0.732 resistance, so now that one is its main support. On the upside, the 50-EMA is the first barrier to the bullish movement, followed by a price resistance at $0.768 and the 200-SMA located at $0.785.
Below there, we spot the aforementioned support at $0.732, followed by the $0.7067 level, right where the trendline coming from the monthly highs is located. If that level was lost, Ripple would go straight back to the $0.678.
MACD in the 4-hour chart shows a positive profile both in amplitude and inclination, and it is now meeting the equilibrium area of the indicator. It's likely that it will follow the profile shown by the Ethereum one.
Directional Movement Index in the same chart shows a similar outlook than the other Cryptos analyzed, although here the ADX is at higher levels that will need more time to be able to fully develop its pattern.
Author

Tomas Salles
FXStreet
Tomàs Sallés was born in Barcelona in 1972, he is a certified technical analyst after having completing specialized courses in Spain and Switzerland. He expanded his technical training following the guidance of great experts on the financial markets.


