Top 3 Bitcoin, Ethereum & Ripple: Getting back key levels but still lacking confidence
- Technical indicators are pointing to a bullish movement in the next hours for Bitcoin and Ethereum
- Ripple and Ethereum have touched extreme levels, drilling yesterday's levels

Cryptocurrencies are finally seeing some green figures today after touching meaningful supports again yesterday. Today's 4-hour charts show the first sizeable bullish candles after accumulated falls around 20% during the last ten days.
It looks like the outlook is positive in the short-term, with some small possibilities of developing some more bullish legs in the mid-term. Still, the main scenario continues to be fully bearish as we haven't reached yet technical levels that might indicate a change of trend.
BTC/USD 4H chart

Bitcoin has recovered the $6400 level lost yesterday, finally taking a breather after many days of consecutive falls. Asian trading brought some relieve to the bulls after another bearish American session.
BTC/USD is trading just below the superior trendline of the bearish channel that is located at $6570. Breaking above that barrier would indeed bring some more optimism, and bulls could finally see some light at the end of the tunnel.
On the upside, we see a first price congestion resistance at $6830, where it will probably end up meeting the 50-EMA. The target of this bullish action will be the $7500 mark, but to reach it, Bitcoin will need to first clear the $7100 mark, the 100-SMA at $7300 and another price congestion resistance at $7400. This is a tough battlefield for the bulls.
On the downside, there are clear levels to watch for. Yesterday's low at $6129.75 is a critical point which, if broken, would again trigger high levels of anxiety among bulls. Don't expect any meaningful action to the downside until that level is breached, though. If that finally happens and those lows are lost, the primary bearish target will be at $5850, February 3rd low.
MACD in the Bitcoin 4-hour chart is slightly crossed to the upside, so the underlying force in the short term is bullish. Big room to cover to the upside that will probably be accompanied by quick falls to unnerve traders.
Directional Movement Index in the same chart is confirming this situation, with sellers still at high levels and with some distance over the buyers. The current scenario draws a progressive increase of the bulls, coupled with falls in the selling levels. ADX is relaxing some, but still at pretty high levels, so any bearish movement might be strong.
ETH/USD 4H chart
-636645675714328644.png)
Ethereum is also getting back the critical level lost yesterday at $480 and is now trying to consolidate the price congestion level at $485. Above there, there are multiple barriers, starting with a meaningful trendline at $505, followed by a price congestion resistance at $520 and the 50-EMA, that will probably hover around that level. The main target of the current movement is at $550, from where we might draw a bullish scenario in the mid-term.
On the downside, we can find a weak support at $480, but the most important level to watch is at yesterday's lows, at $449.78. Below there, anxiety levels might be triggered, with big falls down until the $400-$350 area.
MACD in the Ethereum 4-hour chart is also crossed to the upside, with room for a bullish development. The fact that this indicator is moving alongside the negative side of the indicator is warning us about some potential falls after each bullish leg.
Directional Movement Index in the same chart is also showing how sellers have taken control of the situation, while buyers follow the price but don't lead to any rises. There is no confidence and you can tell that seeing that any levels that are taken back don't trigger any immediate bullish continuation.
XRP/USD 4H chart
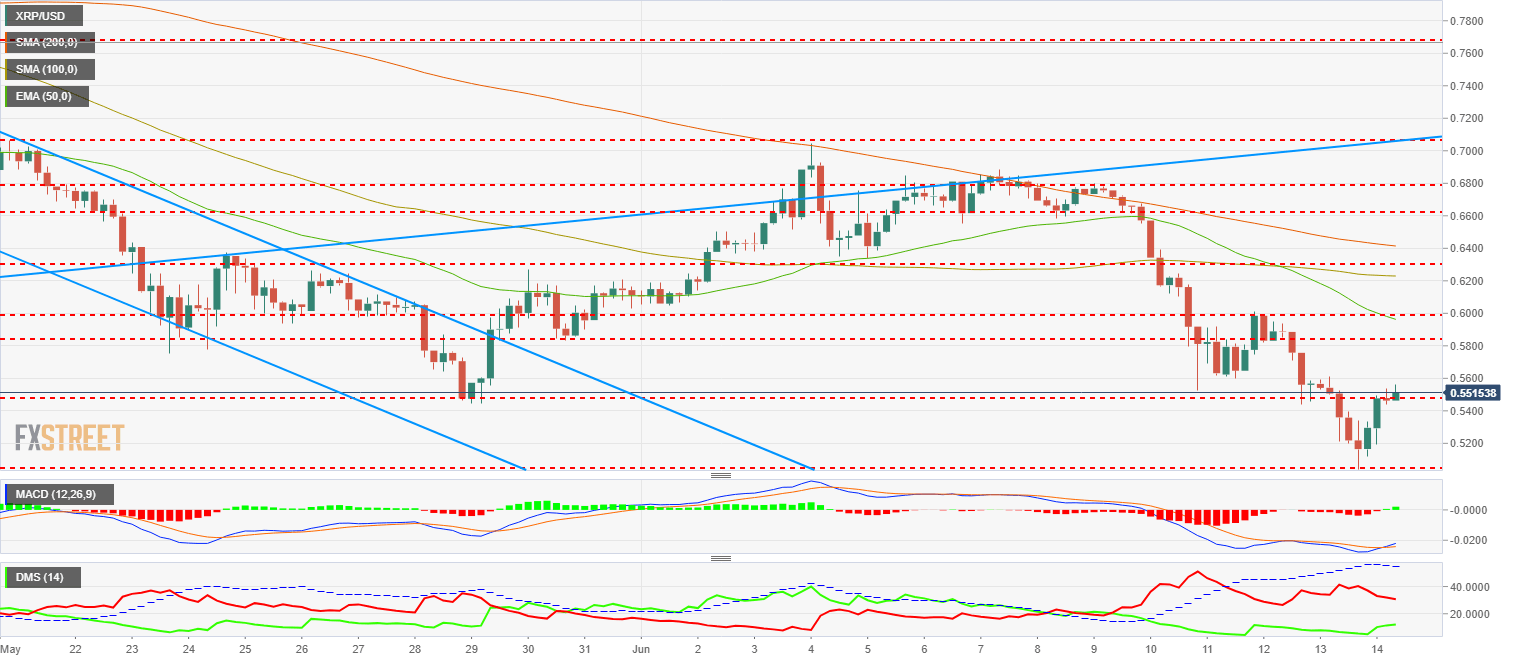
Ripple fell down yesterday until the support located at $0.5042, where it turned to the upside to get back in the opening level at $0.55. A 20% accumulated move in just 24 hours. If the low reached yesterday is lost, next support will be at February's lows at $0.45.
On the bullish side, the first target has already been met at the mentioned $0.55 level. Following targets will be located at the price congestion resistance at $0.585, where it will probably meet the 50-EMA. Further above, another price resistance at $0.60 and the primary target at the 200-SMA, trading around $0.64.
MACD in the Ripple 4-hour chart is crossed to the upside with some good inclination and with room to cover until reaching the equilibrium level. Bullish potential but with possible falls as the indicator is still in negative territory.
Directional Movement Index in the same chart shows how sellers are controlling the market. They have diminished their strength a bit, but the meaningful move is coming from the buyers, that have reacted and are growing after a bit of a consolidation in the last 4 hours.
Author

Tomas Salles
FXStreet
Tomàs Sallés was born in Barcelona in 1972, he is a certified technical analyst after having completing specialized courses in Spain and Switzerland.


