Top 3 Bitcoin, Ethereum & Ripple price prediction: looking for lows at meaningful levels
- Pessimism looms across the Crypto market
- New levels just reached are making traders re-draw their mid-term technical outlooks

The Crypto board is taking a breather today after some sell-offs have taken the market back to pessimism levels not seen since February. The current situation is making us re-draw the technical scenario, looking to understand the possible price developments.
BTC/USD 4H chart
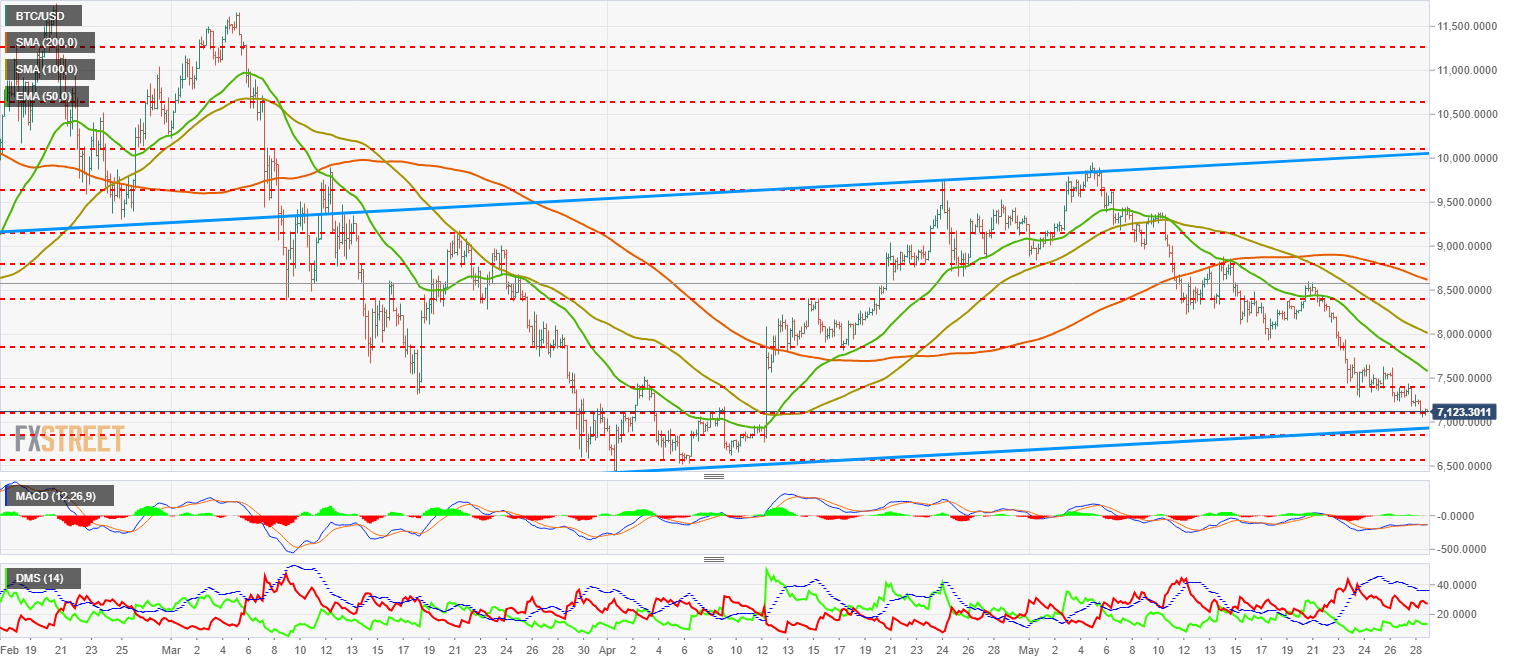
We are opening the focus in the Bitcoin chart, looking for a new technical frame to draw mid-term technical scenarios. There is a slightly bullish channel that was shaped with the April lows. The base of the channel is right now at $7000, very close from the current price. Divergent formations in the indicators might make us think in an increase of the buying interest in the last bearish leg.
On the downside, the current support is at $7100 as the last step before the floor, located at $7000. Below there, and in a much more pessimistic scenario, we would find support at $6850 and $6600.
On the upside, the first target is at $7400, and further up we can find the 50-EMA in the $7600 mark. Another resistance can be found at $7850, with the 100-SMA awaiting at $8000.
MACD in the Bitcoin 4-hour chart is still showing a divergent profile during all the bearish leg from the channel's ceiling. There is not much room to the downside before entering a very dangerous territory for the long-term bulls.
Directional Movement Index in the same chart is showing how buyers keep increasing their activity levels while sellers are still at high levels. ADX is reducing its intensity and backs the idea of a possible improvement in the BTC/USD situation for the next sessions.
ETH/USD 4H chart
-636631866879238858.png)
Ethereum is getting into an uncertain territory, on the upper side of a slightly bullish channel with the base at the $410 mark. ETH/USD is also inside a mid-term bearish channel with a strong inclination to the downside. Bulls need to take the price out of this channel as soon as possible. This will not be an easy task, as there are strong clusters of levels, moving averages and trend-lines that offer great resistance to bullish price action.
On the downside, the current support is at $520. If that was lost, Ethereum would find support at $495, just where the base of the channel is located. Further down, we find support at $485, but below there we find a big void until the $419 mark.
On the upside, first resistance is at $560, followed to the upside by the 50-EMA at $594 and another price resistance at $617.
MACD in the Ethereum 4-hour chart is also showing a divergent structure compared to the price action, a pattern that might favor the bulls soon.
Directional Movement Index in the same chart indicates the increase in the buying interest has lost steam, while sellers are gathering impulse again and the ADX is recovering, showing a good trend strength.
XRP/USD 4H chart
-636631867246477125.png)
Ripple rests above a trendline that comes from early April but it is also framed by the bearish parallels that have been ruling its price action on May. It seems an appropriate entry level for a bullish reaction, but with such a pessimist environment, it's difficult to envision it.
On the downside, avoiding levels not seen since 2017, the current support is at $0.5493, just below the aforementioned trendline resting at $0.53. Below there, we can find the base of the bearish channel, which is located at $0.517 and further down, the last safety level at $0.4959.
MACD in the Ripple 4-hour chart is showing a divergent structure in the whole bearish run. This kind of pattern indicates a change of trend, which tould take Ripple back to the upside, but its development can extend for a while.
Directional Movement Index in the same chart is showing how buyers are losing strength after having gathered some in the recent periods. Sellers, on the other side, are back increasing their strength and pumping the ADX again to strong trend levels.
Author

Tomas Salles
FXStreet
Tomàs Sallés was born in Barcelona in 1972, he is a certified technical analyst after having completing specialized courses in Spain and Switzerland. He expanded his technical training following the guidance of great experts on the financial markets.


