Top 3 Bitcoin, Ethereum and Ripple price prediction: different scenarios, same script
- Three main Cryptocurrencies retracing after reaching different key price levels
- Ripple reaches net bullish territory but has been rejected by the 200-SMA

The three main Cryptocurrencies kept their bullish profile during the weekend, reaching key levels today in the early Asian trading session. These levels have not breached at the time of this writing.
This is a very particular technical scenario, as each one of this trio of Cryptos has its own different scenario, but with similar results in the price action.
On the other hand, the Crypto sphere is hot with breaking news of new projects willing to improve the technology. Ethereum is trying to increase the number of transactions per second that can be handled. Meanwhile, EOS is launching an own network to challenge Ethereum's dominating position. This is a very competitive sector, where innovation is hardly unlimited. Nobody can blink, at the risk of losing some decisive edge. A perfect situation for potentially big profits.
BTC/USD 4H chart
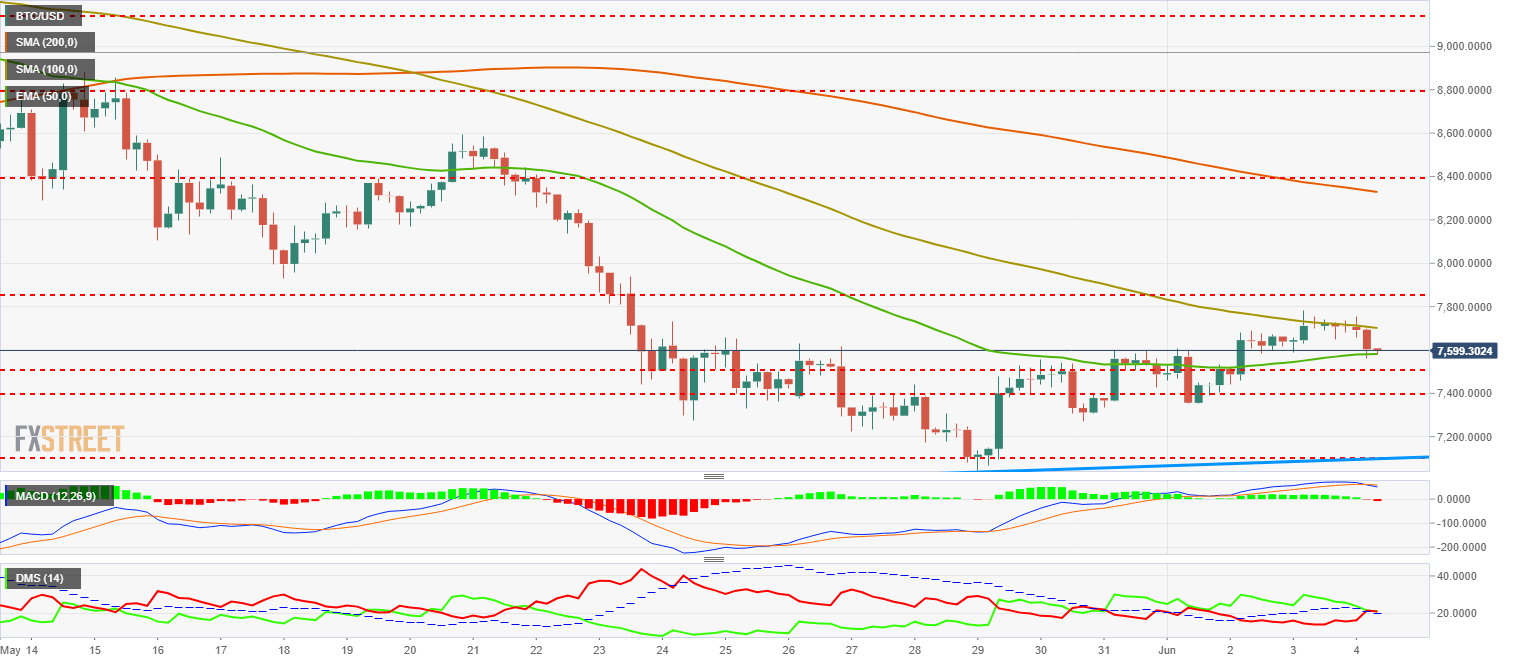
Bitcoin bulls are having a hard time to start the week, after reaching the 100-SMA during the week but not being able to close above there. BTC/USD has retraced back to the 50-EMA and taken some breath there, in a compression scenario that will likely take the price back below the exponential average, with a possible test of the $7505 mark in a first attempt, and the $7400 level as a less likely second target. We can't take out of the cards a quick technical move in search of the base of the channel at $7120. Such a move would shake many weak hands in favor of more experienced ones.
On the bullish side, the bears would be doomed with a close above the 100-SMA, with a possible first attempt to conquer the $7850 level. From there, bulls should gather more steam for an attempt to reach the 200-SMA around $8300.
MACD in the Bitcoin 4-hour chart presents a crossed to the downside profile, after reaching the bullish area of the indicator during the weekend. There is better potential for a slightly bearish lateral scenario, but within a context of bullish consolidation.
Directional Movement Index in the same chart shows total equilibrium, with buyers weakened while sellers have strengthened. ADX is still trading at trend strength levels, backing the lateral movement while possibly hinting that the first trading days of the week could be quiet.
ETH/USD 4H chart
-636637036488655783.png)
Ethereum is trading in a very similar tactical situation than Bitcoin, but in a very different technical scenario. ETH/USD reached during the weekend the ceiling of a bearish channel that rules the price since the end of April. Ethereum was able to overcome the 50-EMA and the 100-SMA to reach the most meaningful barrier with very few strength remaining. The technical picture is still bearish, with the channel still intact and the moving averages pointing to the downside.
Below the current price, the first support is located at the 50-EMA, now trading in the $590 area where a price congestion support is located. If that double support is lost, no more key levels can be found until $565, the last support to keep the short-term bullish impulse from last days.
As the first bullish target, Ethereum needs to recover the 100-SMA at $610 as the previous step to conquer the very important $620 level. That's where the bearish channel ceiling and a price congestion resistance meet. If that level was breached, next target would be at $660, where it would easily meet the 200-SMA.
MACD in the Ethereum 4-hour chart shows a similar profile than Bitcoin, but it still has not been able to cross, which will probably happen in the next hours. This scenario weakens the bullish potential, but it is a normal situation once the indicator gets on the positive side.
Directional Movement Index in the same chart is quite different from the Bitcoin one. Buyers are still in control despite trading now below the ADX, while sellers have increased, facing a very clear opportunity with the arrival at the ceiling of the channel. Bullish potential but already on the final phase of the current impulse.
XRP/USD 4H chart
-636637036871629438.png)
Ripple is the Crypto with the most interesting scenario right now. After having breached the trendline that separated it from a fully bullish scenario, XRP/USD has been rejected to the downside. The first attempt at the 200-SMA has resulted in a candlestick turning formation. The bearish candlestick that closes this formation has brought Ripple price back below the trendline, sending a clear message that it is still early to enter a new fully bullish scenario. This technical picture makes me think that bulls are being very careful, controlling the tempo and being very vigilant to the technical signals. All in all, big rises seem to be in the cards for the most disruptive technology to appear since the rise of the Internet.
On the upside, the first resistance is located at the aforementioned trendline, right at the $0.673 mark. A few pips above, at $0.68, we can find a price congestion resistance, while the 200-SMA awaits on yesterday's relative high, at $0.70.
On the downside, the first support is located at the current price $0.66, followed below by a weak target at $0.645. Next support should be strong, at $0.63, where the 50-EMA, the 100-SMA and price congestion support are meeting. That level shouldn't be lost if bulls want to stay in command. A very bearish scenario below there.
MACD in the Ripple 4-hour chart shows how this indicator is one of the few things working in today's analysis. Very close to crossing to the downside, it is indicating bullish weakness and the need to take back the 0 level to confirm the bullish viability of the current movement.
Directional Movement Index in the same chart is similar than the one we've seen in the Ethereum analysis. Buyers are dominating the current scenario but are still trading below the ADX and have completed the bearish confirmation pattern. Sellers have reacted strongly to the Candlestick turning formation, but its situation is still weak, as few pips might execute their stops.
Author

Tomas Salles
FXStreet
Tomàs Sallés was born in Barcelona in 1972, he is a certified technical analyst after having completing specialized courses in Spain and Switzerland. He expanded his technical training following the guidance of great experts on the financial markets.


