Three technical Indicators suggest Cardano price may drop to $1 in a few weeks
- Cardano price rally attempts were rejected by the 50 twelve-hour simple moving average (SMA) at $1.60, creating downward pressure.
- Anchored volume-weighted average price (anchored VWAP) at $1.63 reinforces the moving average.
- Ichimoku cloud on the twelve-hour chart envelops vital indicators, creating a narrow price range and exhaustive resistance.

Cardano price is restrained by May’s declining trend line, the Ichimoku Cloud, the 50 twelve-hour SMA and anchored VWAP. The result has been a narrowing range, increasing the probability that ADA will resolve the congestion to the downside in the weeks ahead.
Tactically important moving average presses down on price
A moving average is a basic calculation used to study data points by compiling a series of averages of different subsets of the complete data set. In technical analysis, a moving average is an indicator that is overlaid onto a chart.
The reason for calculating a moving average is to smooth data that is constantly updated. Thus, the impact of short-term fluctuations or outliers is reduced. In addition, the longer the time interval, the less sensitive the average will be.
Moving averages can determine support or resistance and the direction of the financial instrument over specific time frames.
A review of the ADA twelve-hour chart reveals the importance of the 50 twelve-hour SMA in instructing price, whether it be as support or resistance. In the current case, the moving average has been notable resistance or provided a magnet effect to limit new rally opportunities from lifting meaningfully above the moving average.
Moreover, the moving average has been declining, putting downward pressure on Cardano price as it contemplates a clear direction while resting close to the omnipresent support of the 2018 high at $1.40.
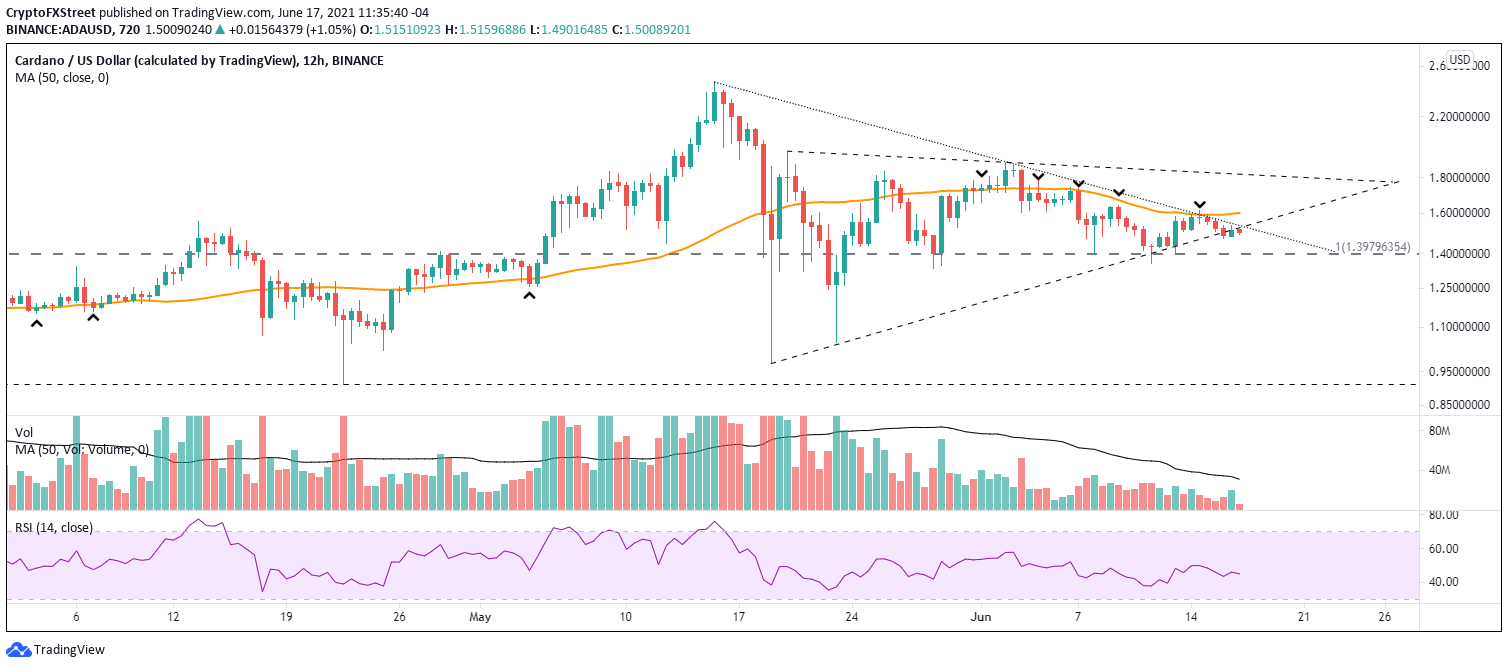
ADA/USD 12-hour chart
Ichimoku Cloud supports a bearish outlook
According to Investopedia, “the Ichimoku Cloud is a collection of technical indicators that show support and resistance levels, as well momentum, trend direction,” and provide trading signals. It does this by considering multiple averages and laying them on a price chart.
The cloud is the most prominent feature of the Ichimoku Cloud plots and is often used to confirm the trend. The trend is higher when ADA prices are above the cloud, down when prices are below the cloud and flat when prices are in the cloud.
The position of the Ichimoku Cloud on the twelve-hour chart confirms that Cardano price is in a downtrend for the foreseeable future, with evident price resistance levels available. Therefore, unless ADA can manufacture a rally above the cloud, the outlook for the green token is tilted to the downside.
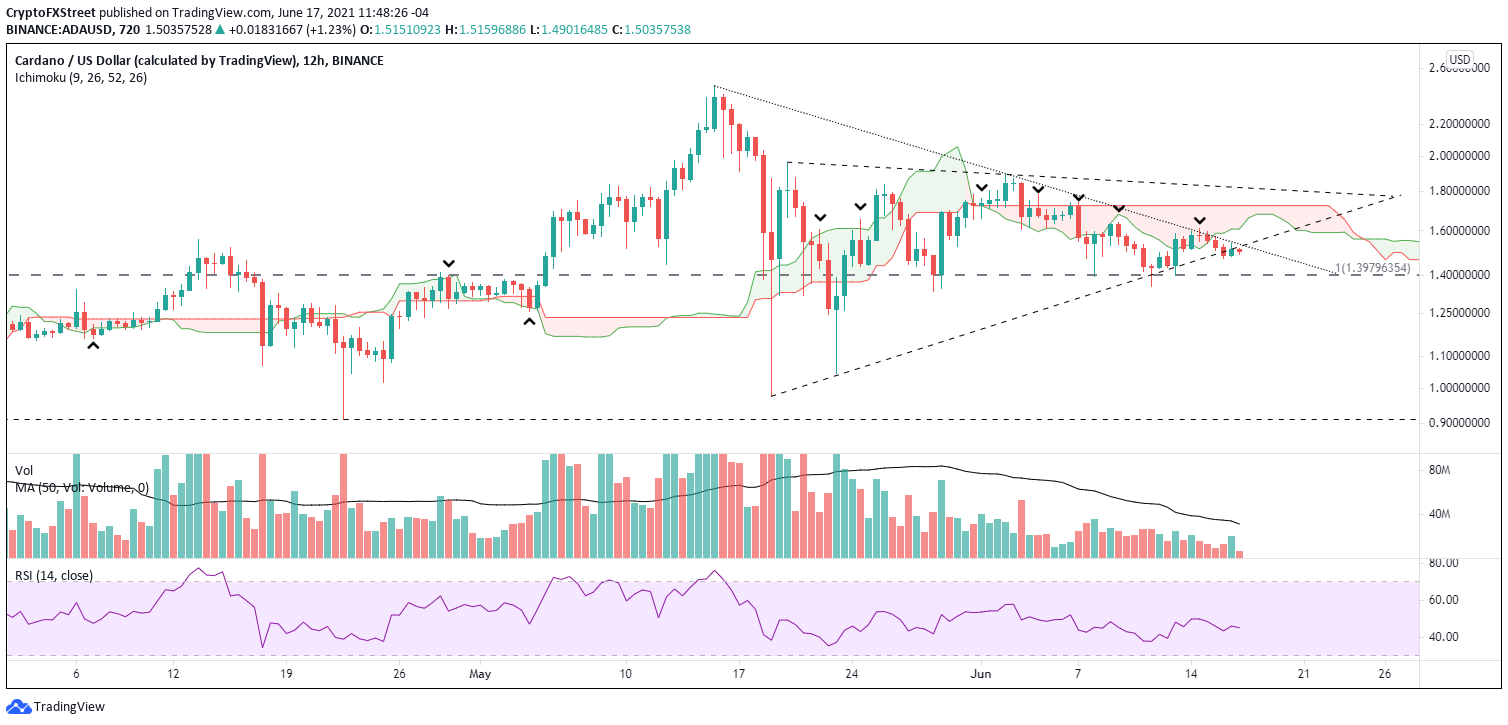
ADA/USD 12-hour chart
Anchored VWAP is strengthened when combined with another indicator
The ADA anchored VWAP connects VWAP calculations to a specific price bar. It incorporates price and volume in a weighted average and identifies areas of support or resistance.
Anchored VWAP allows a market operator to specify the price bar where calculations begin, making it easy to see whether the ADA bulls or bears have been in charge during a specific time. The starting bar that is selected often marks a shift in the market, driven by a significant high or low, earnings or other pertinent announcements.
In Cardano price, the anchored VWAP begins on April 22, where a significant hammer candlestick swept the previous lows of a long consolidation before closing near the high of the candlestick. It marked a change in the trend that drove ADA over 100% higher in the following days.
Currently, the anchored VWAP is tilted slightly down, suggesting no clear bull or bear leadership. Still, it resides just above the 50 twelve-hour SMA, fortifying the resistance shown.
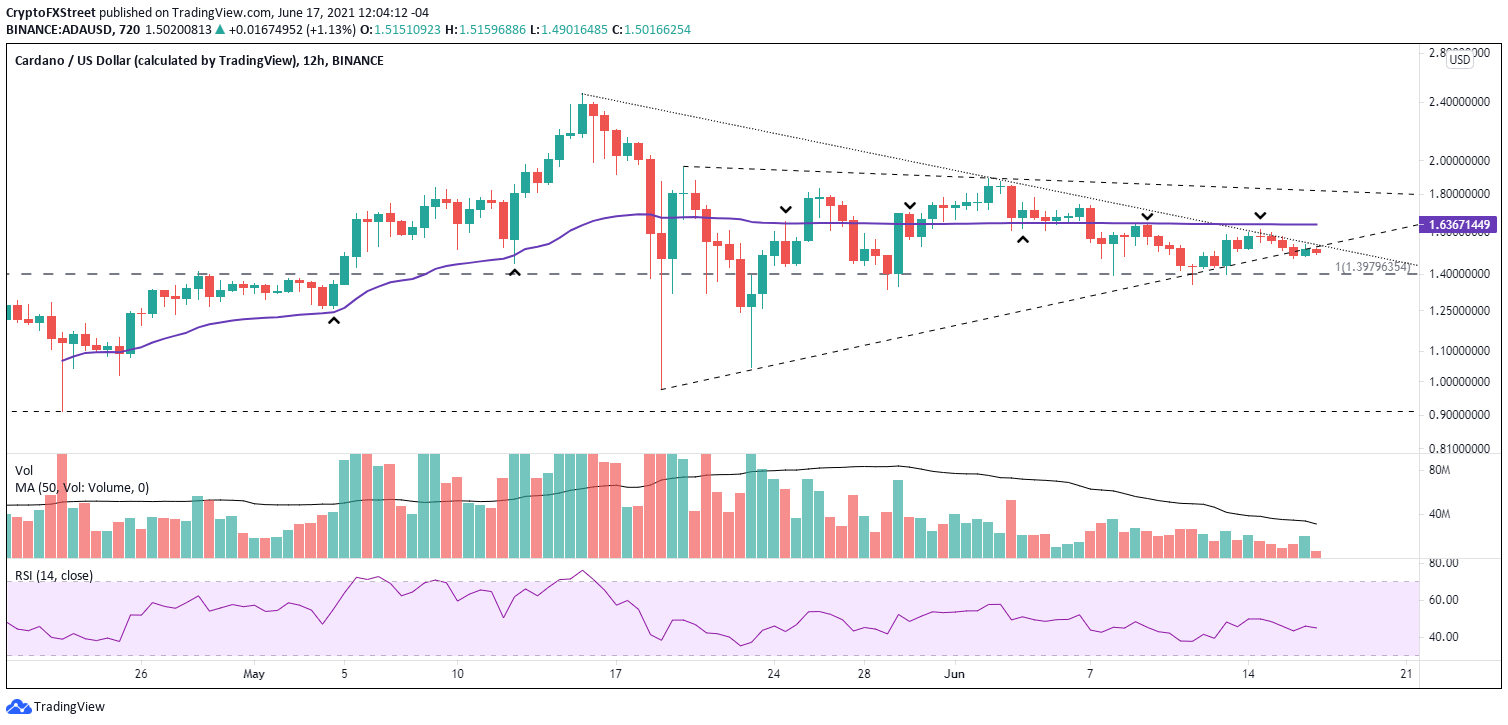
ADA/USD 12-hour chart
Cardano price has not definitively revealed its directional intentions. Still, the overwhelming resistance and weight framed by the 50 twelve-hour SMA, the Ichimoku Cloud and the anchored VWAP raise the odds of a lower Cardano price moving forward.
Only a clear break above the chorus of the three indicators will confirm an alternative ADA scenario. For now, Cardano price stresses the support of the 2018 high of $1.40 as the indicators close in.
In the following video, FXStreet’s analysts evaluate where Cardano price could be heading next, considering technical and on-chain analysis.
Author

Sheldon McIntyre, CMT
Independent Analyst
Sheldon has 24 years of investment experience holding various positions in companies based in the United States and Chile. His core competencies include BRIC and G-10 equity markets, swing and position trading and technical analysis.


