Three reasons why Solana could hit $250
- Solana is less than 20% away from the $250 resistance, hovering around $200.
- Momentum indicators on the daily chart support a bullish thesis for SOL.
- Top 5 Solana treasury companies bought over $166 million in SOL in the last thirty days.
- The total value of assets locked in Solana’s chain climbed nearly 15% in the same timeframe.

Solana (SOL) is trading near the $200 support level on Friday. The Ethereum alternative token could target the $250 resistance, while several factors fuel a bullish thesis for the altcoin.
The three key catalysts are institutional demand, rising value of assets locked in the Solana blockchain and the momentum indicators on the daily SOL/USDT price chart.
Solana sees rise in institutional demand
Data from crypto intelligence tracker CoinGecko tracks institutions that hold Solana tokens in their treasury. The top five firms tracked by CoinGecko hold over 4.2 million SOL tokens. These firms have added $166 million worth of Solana to their holdings over the last thirty days, per CoinGecko.
The five firms are tracked across two countries and the value of their SOL holdings climbed over 15% in the last 24 hours.

Solana treasury holdings | Source: CoinGecko
Total value of assets locked in Solana climbs 15%
Data from TheBlock shows that Solana’s Total Value of assets Locked (TVL) on the chain has climbed to $11.63 billion on Thursday from $10.22 billion on July 28, a nearly 15% increase within thirty days. The TVL is a metric considered indicative of a platform’s utility and user trust.

Solana TVL | Source: TheBlock
The increase in Solana’s TVL supports a bullish narrative for the token.
Solana eyes retest of $250 resistance
The SOL/USDT daily chart shows that Solana has been in an uptrend since April. The Ethereum alternative token hovers close to its $200 support, less than 15% away from the $250 resistance.
The two key resistances are $228.24 and $247.18. These levels coincide with the upper boundary of a Fair Value Gap (FVG) on the daily chart. If Solana sees a daily candlestick close above these levels, it could target the all-time high at $295.83.
Looking down, SOL could find support at $200, a key level for the altcoin, and at $175.
Two key momentum indicators, Relative Strength Index (RSI) and Moving Average Convergence Divergence (MACD), support a bullish thesis for Solana on the daily chart. The RSI reads 63 and the MACD shows green histogram bars above the neutral line, meaning that there is a positive underlying momentum in the SOL price trend with room for further upside before entering overbought conditions.
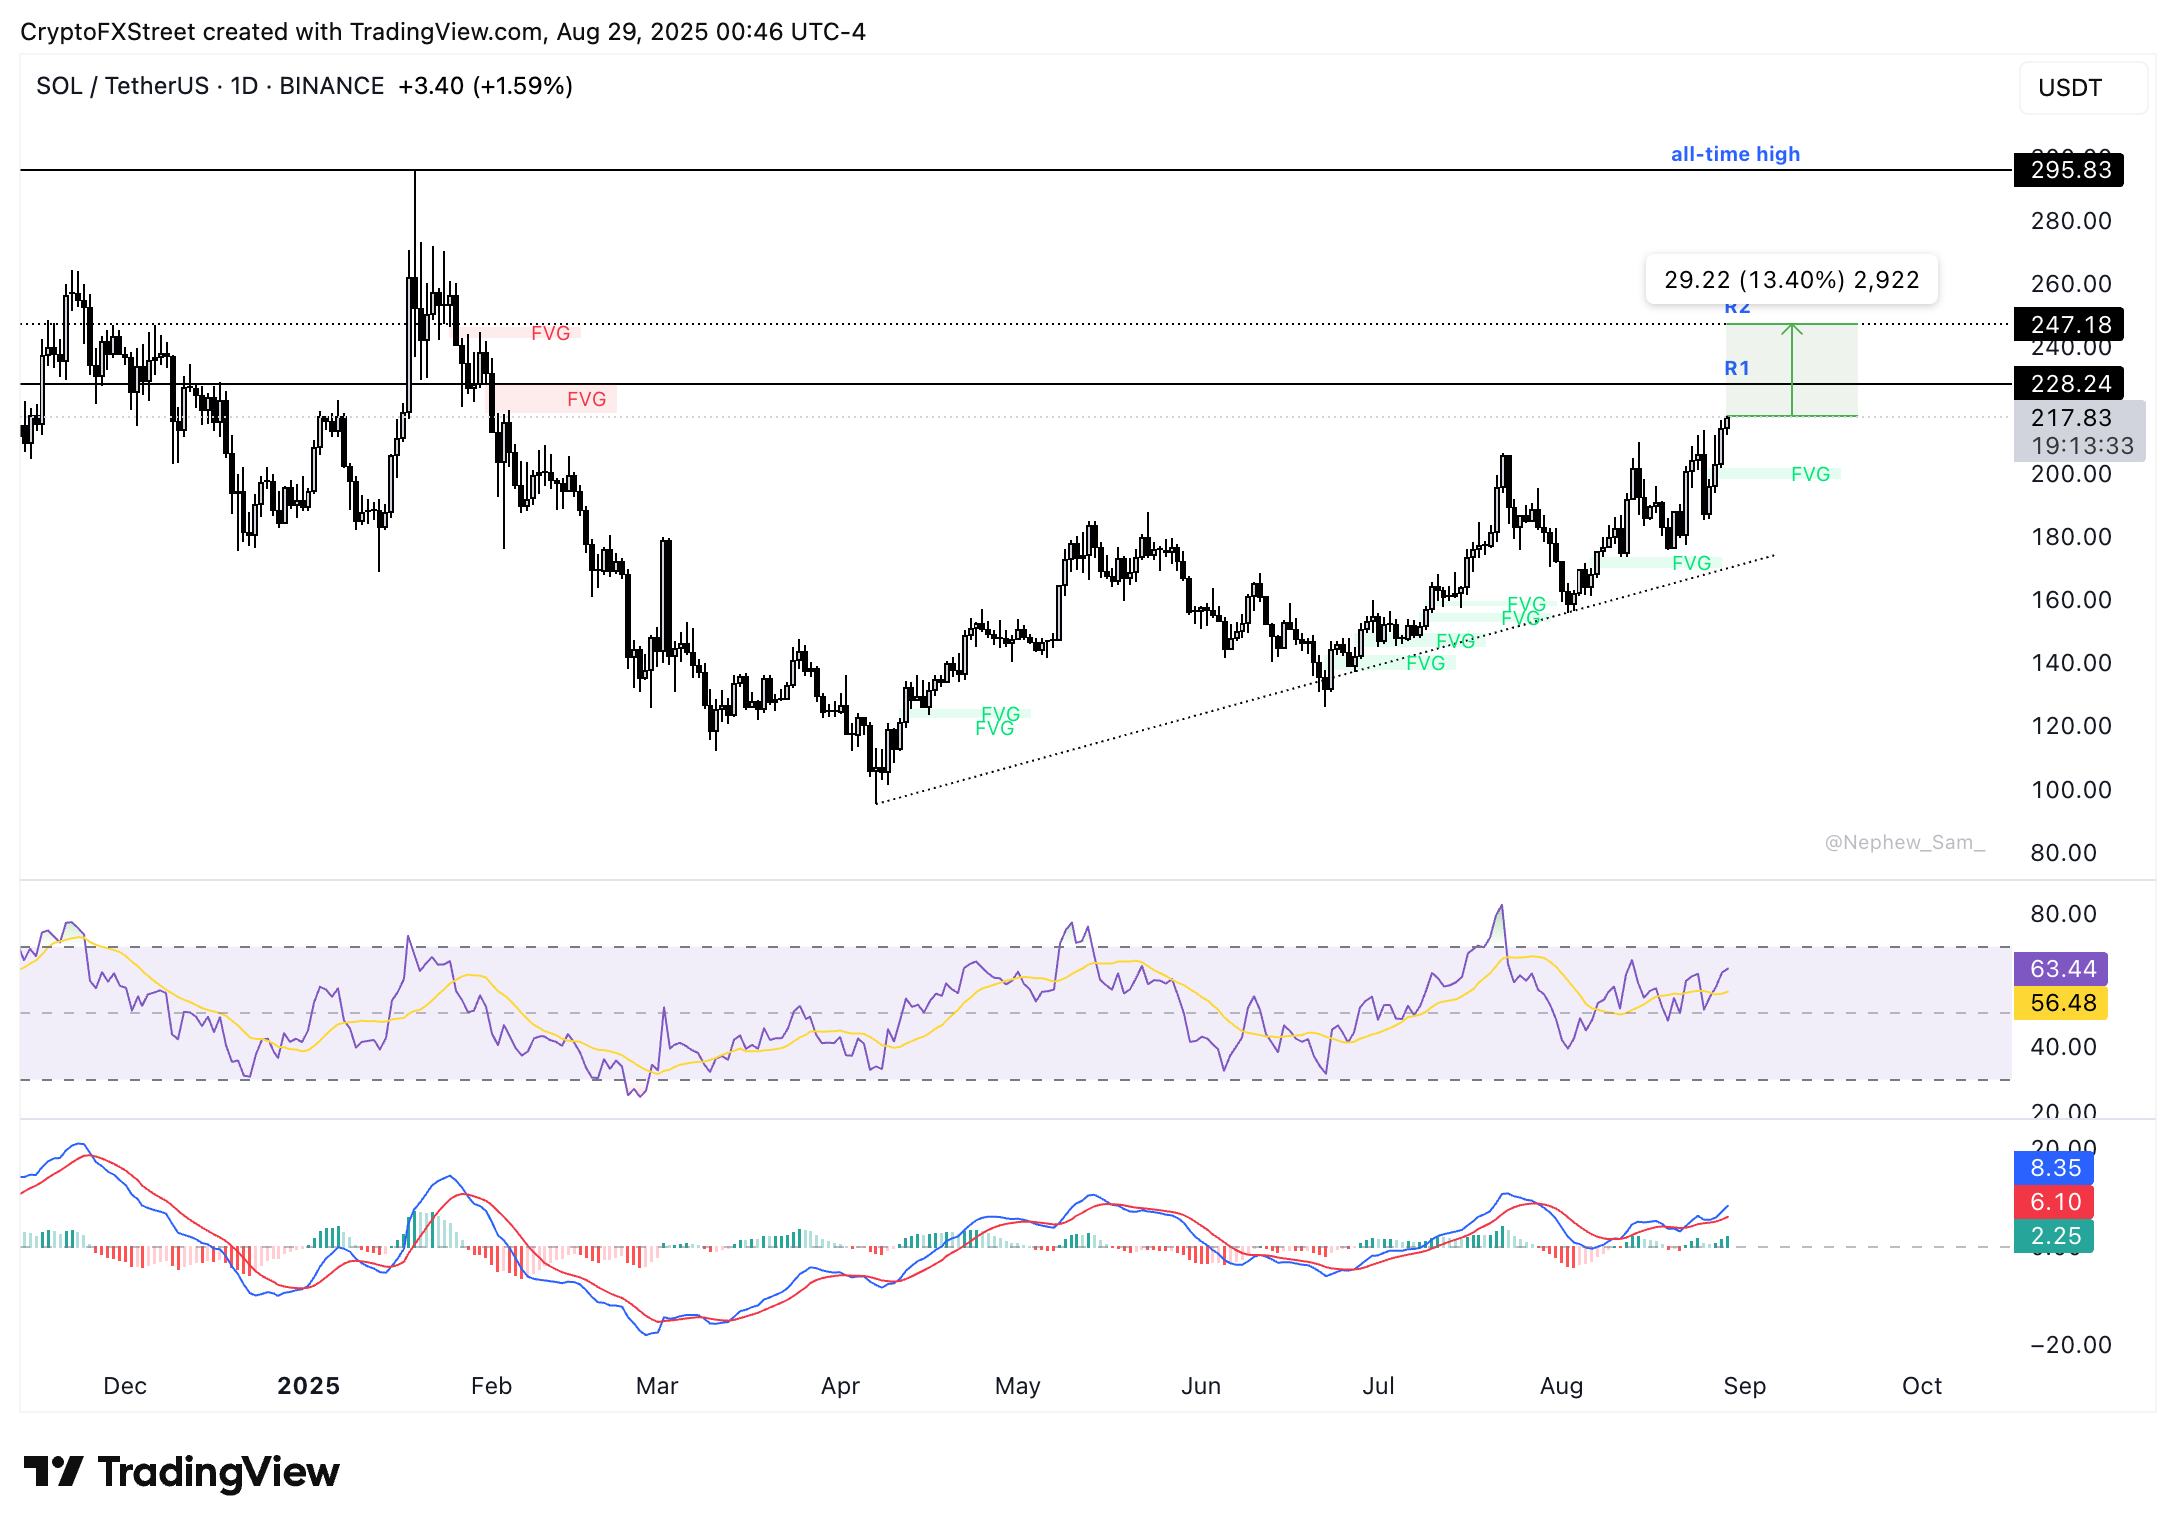
SOL/USDT daily price chart | Source: TradingView
Solana’s re-test of its previous all-time high could bring the $300 level into play, as the token would enter in a price discovery phase.
Author

Ekta Mourya
FXStreet
Ekta Mourya has extensive experience in fundamental and on-chain analysis, particularly focused on impact of macroeconomics and central bank policies on cryptocurrencies.


