This is what traders should consider before trading Polkadot
- Polkadot price continues to produce lower highs and equal lows since May 16, indicating coiling up.
- As DOT approaches the end of this squeeze, a volatile move to $10 seems likely.
- A four-hour candlestick close below $8.51 will invalidate the bullish thesis and potentially trigger further losses.

Polkadot price vies to breakout and rally higher but there are many blockades sprinkled in its path. Due to a tight consolidation, a volatile move could potentially shatter these hurdles and propel DOT to reach its short-term target.
Polkadot price contemplates a rally
Polkadot price began its consolidation on May 13 and has produced lower highs since then. During this time, DOT has stabilized around the $9.20 support level with brief sweeps below it. Going forward investors can expect this consolidation between the $9.20 and $8.51 to continue.
However, a swift recovery above $9.20 and the declining trend line will signal a bullish breakout. This move will confirm a resurgence of buyers. In such a case, the sidelined buyers could step in and trigger a run-up to $0.37, which is a higher time frame resistance barrier.
In some cases, depending on the volatility of the move, DOT could sweep the May 31 swing high at $10.78. If the buying pressure continues to build up, Polkadot price could extend the up-move to $11.98.
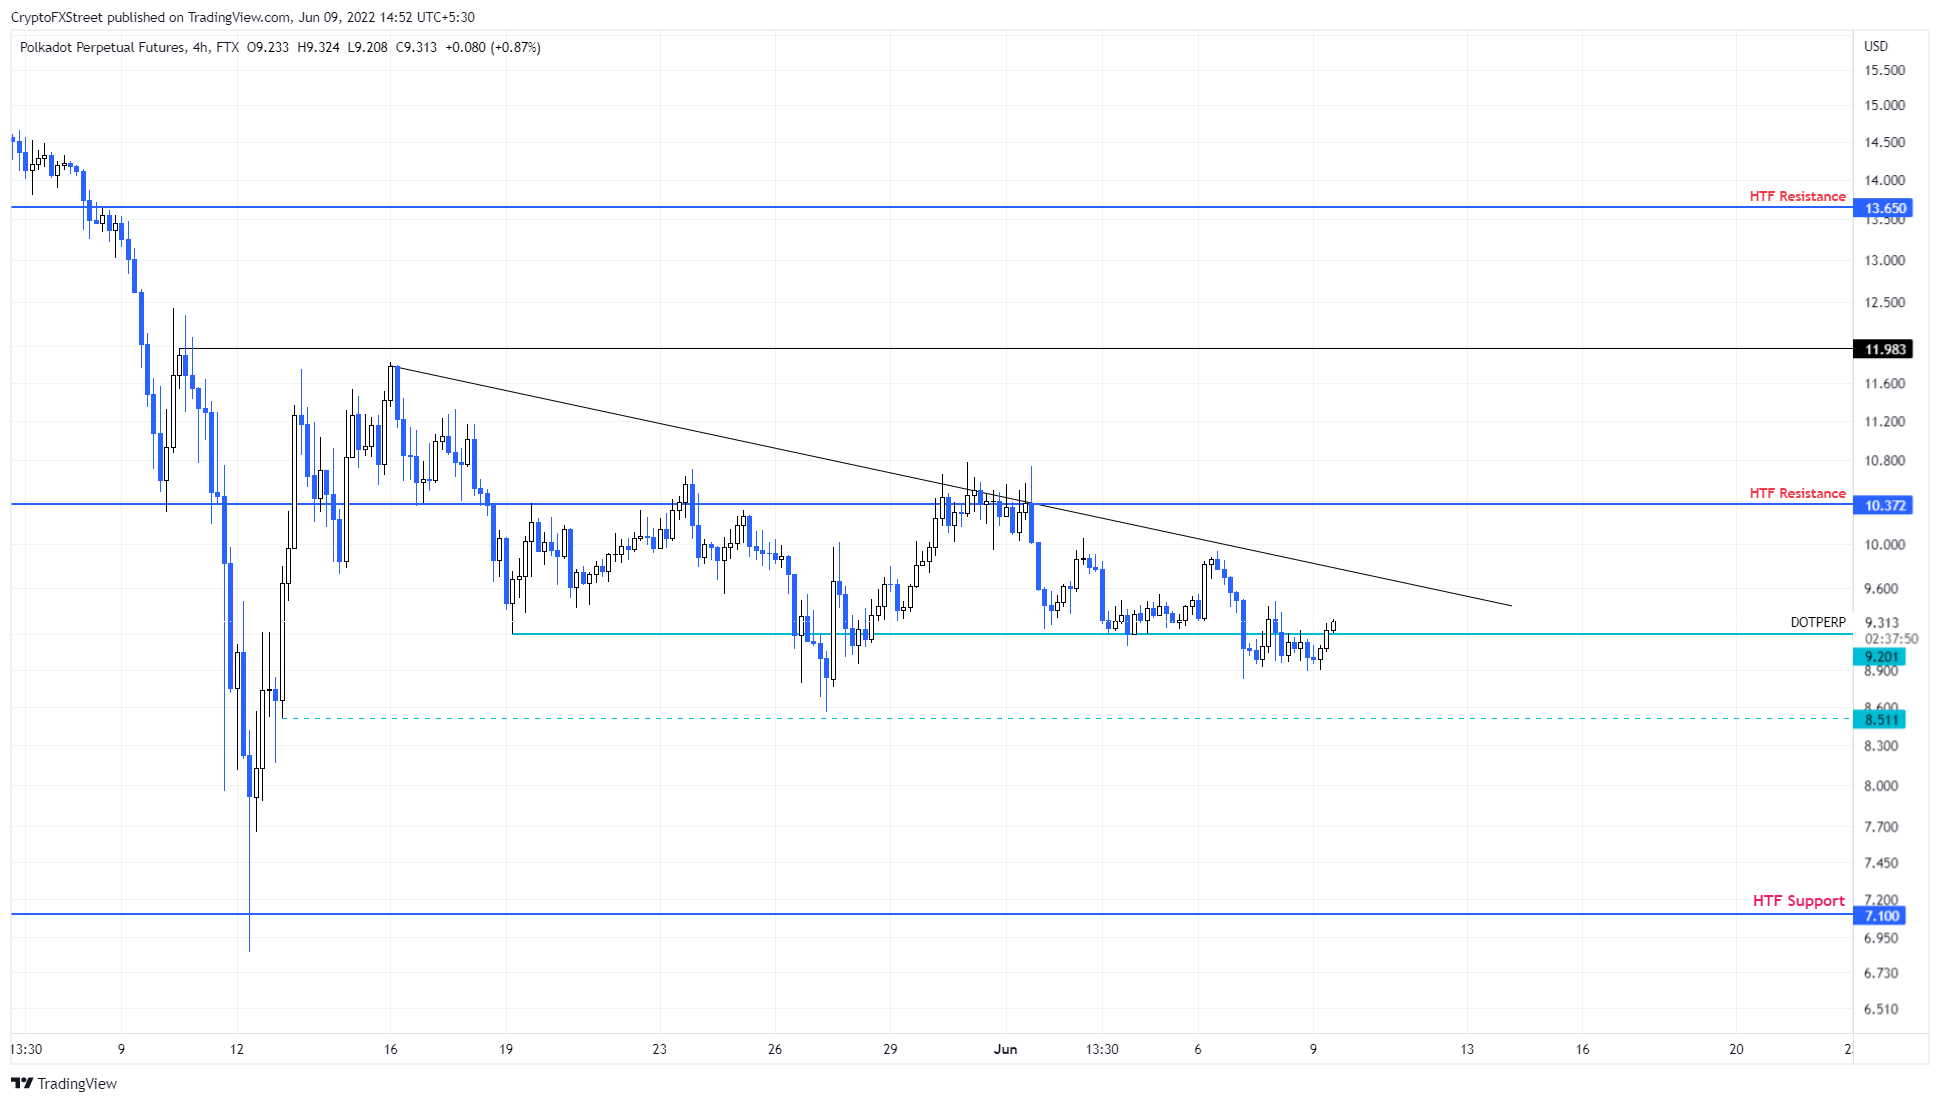
DOT/USDT 4-hour chart
While Polkadot price looks relatively bullish, rejection at $9.20 could dent the bulls’ plan. If DOT produces a four-hour candlestick below $8.51, however, it will create a lower low and invalidate the bullish thesis for DOT altogether. In such a case, Polkadot price could crash lower and retest the $7.1 support level.
Author

Akash Girimath
FXStreet
Akash Girimath is a Mechanical Engineer interested in the chaos of the financial markets. Trying to make sense of this convoluted yet fascinating space, he switched his engineering job to become a crypto reporter and analyst.



