How will Polkadot price fare in an uphill battle
- Polkadot price faces an uphill battle between the high-time-frame resistance at $10.37 and other hurdles in its path.
- A decisive four-hour candlestick close above $11 will improve its probability of an upswing to $13.65.
- A four-hour candlestick close below $9.20 will create a lower low and invalidate the bullish thesis for DOT.

Polkadot price wants to embark on an uptrend but the number of hurdles laid in its path suggests this outlook is unlikely. However, a recovery above a certain barrier will make this bullish narrative more plausible.
Polkadot price has an adversarial path
Polkadot price has been consolidating since May 13 and has constantly produced lower highs and lower lows. On June 2, DOT bulls seem to have stepped in, creating a higher low and tighter consolidation. As a result, the June 6 price action has resulted in a 4% upswing.
If Polkadot price continues in this direction, it will face the declining trend line connecting the lower highs formed since May 13 and also the 100 four-hour Simple Moving Average (SMA) at $9.76.
Adding headwinds to this run-up for DOT is the $10.37 high-time-frame resistance level. Therefore, this cluster of hurdles, extending from $9.76 to $10.37 needs to be overcome for a chance at an upswing. Beyond these blockades, there is also the 200 four-hour SMA at $10.75, which will test the bulls’ strength again.
If Polkadot price manages to produce a four-hour candlestick close above this level and uses it as a support level, the chances of an upswing will multiply. In such a case, investors can expect DOT to attempt a 26% rally to another high-time-frame resistance barrier at $13.65.
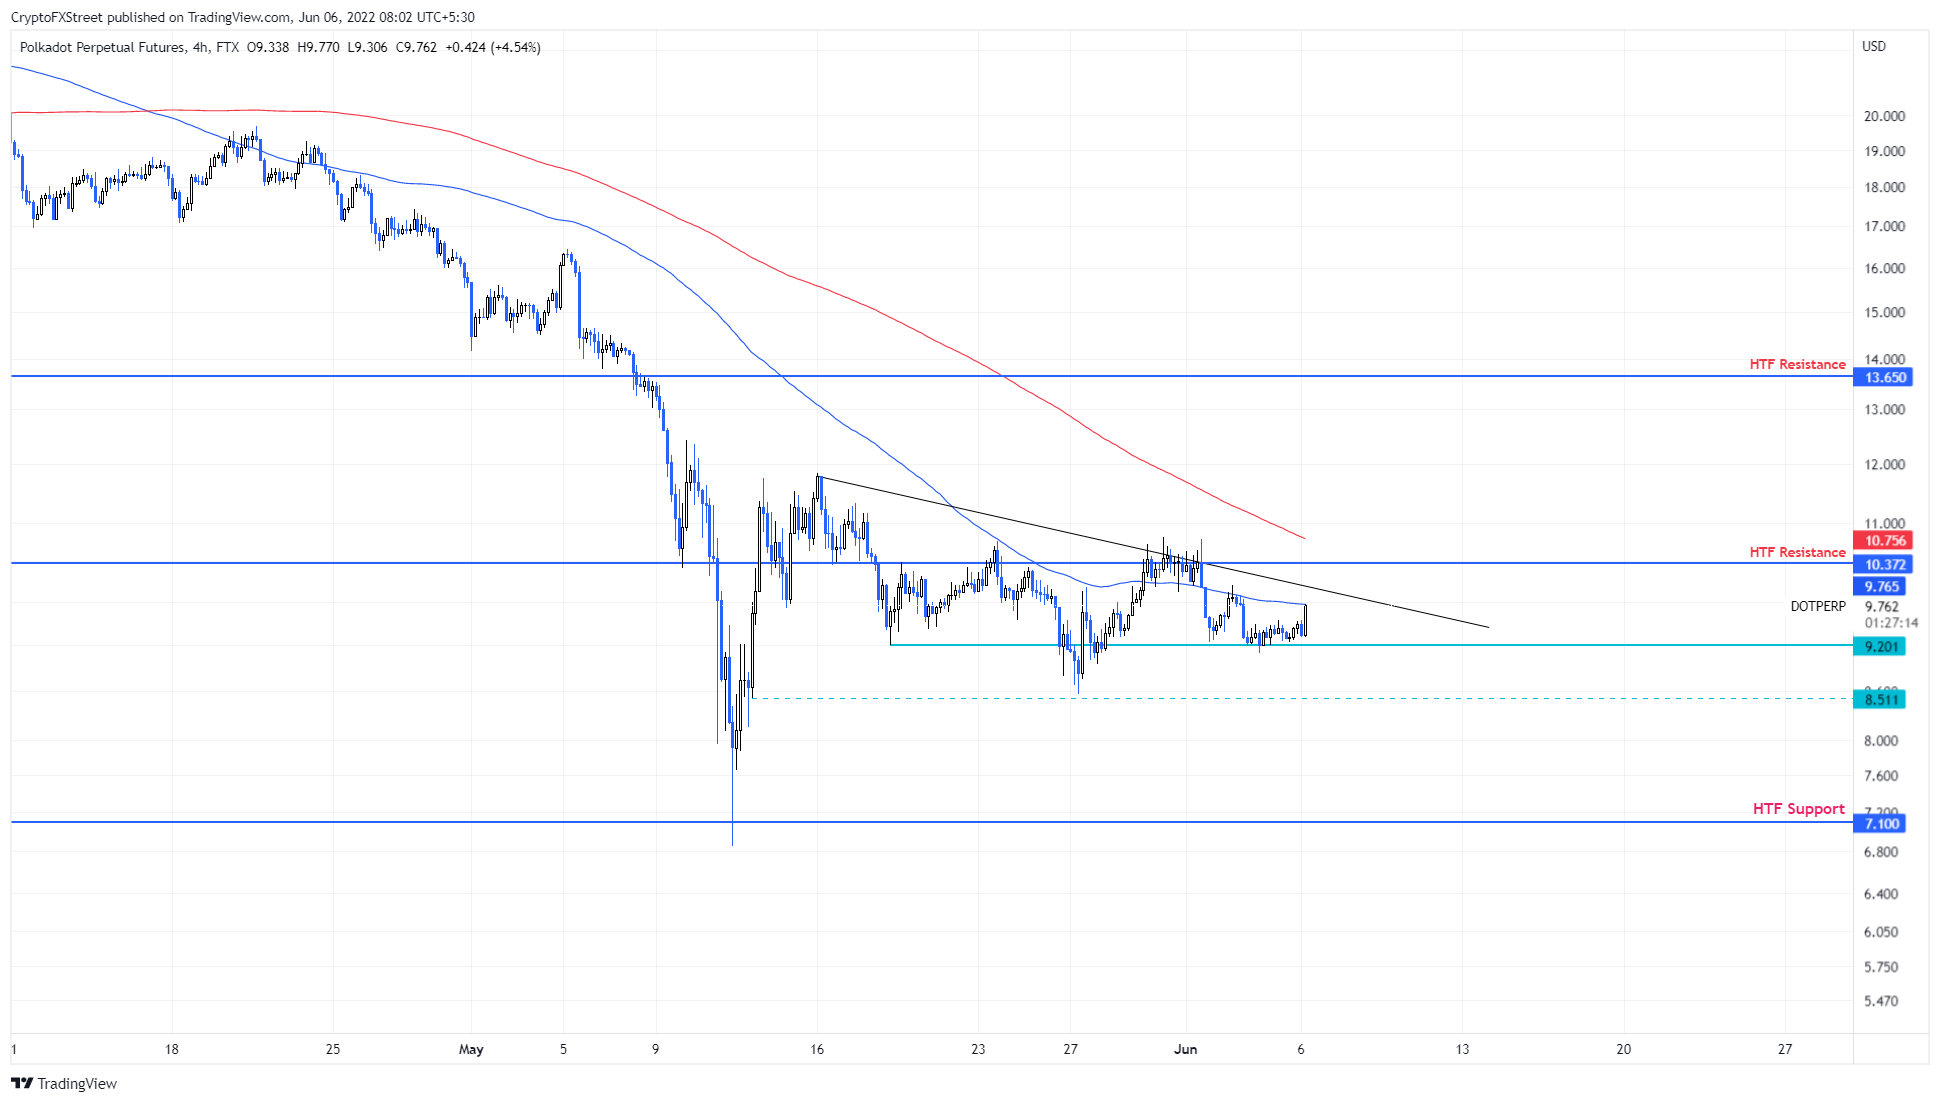
DOT/USDT 4-hour chart
While things are looking particularly tough for Polkadot price and the bulls, rejection at any of these levels could hinder the optimistic narrative. If DOT produces a four-hour candlestick below $9.20, it will create a lower low and invalidate the bullish thesis for DOT.
In such a case, Polkadot price could spend time at an intermediate support level at $8.51 and eventually crash to $7.10 if the selling pressure continues to build up.
Author

Akash Girimath
FXStreet
Akash Girimath is a Mechanical Engineer interested in the chaos of the financial markets. Trying to make sense of this convoluted yet fascinating space, he switched his engineering job to become a crypto reporter and analyst.


