Theta Token Elliott Wave technical analysis [Video]
![Theta Token Elliott Wave technical analysis [Video]](https://editorial.fxsstatic.com/images/i/Theta-network_Neutral_XtraLarge.png)
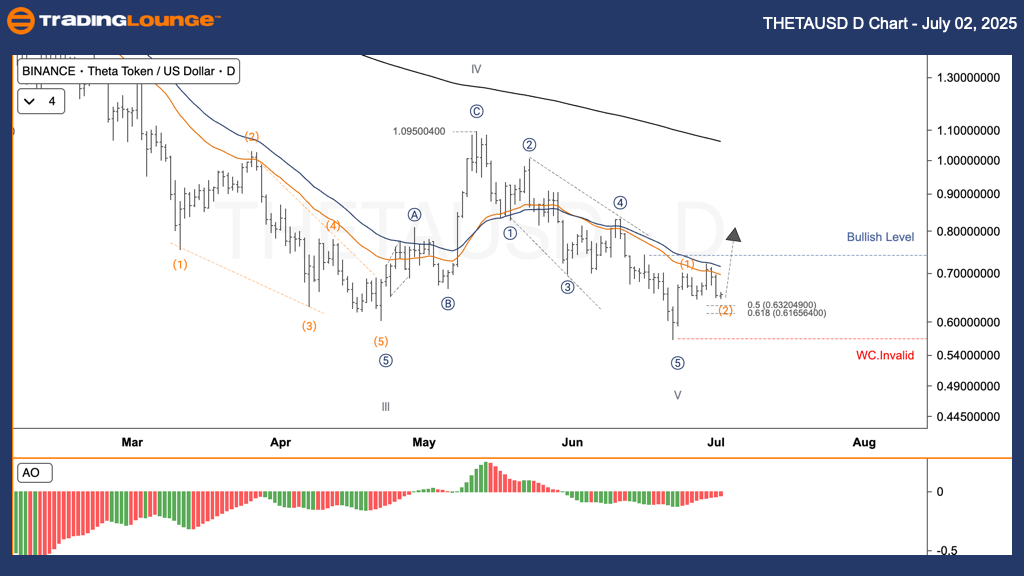
THETA/USD – Elliott Wave technical analysis – Daily chart
-
Function: Follow Trend.
-
Mode: Motive.
-
Structure: Impulse.
-
Position: Wave 5.
-
Next direction: Higher Degrees.
-
Invalidation level: Not specified.
Market overview
Theta Token (THETAUSD) recently completed a major bearish trend and reached a new low. It now appears to be entering a recovery phase, showing signs of a new upward wave structure. Currently, the token is consolidating in wave (2) and has potential to accelerate into wave (3).
Trading strategy
For Short-Term Traders (swing trade):
-
Buy zone: Watch for opportunities to buy on a dip near the 0.6200 USD level.
-
Stop loss: Place a stop-loss below the 0.5600 USD mark to manage downside risk.
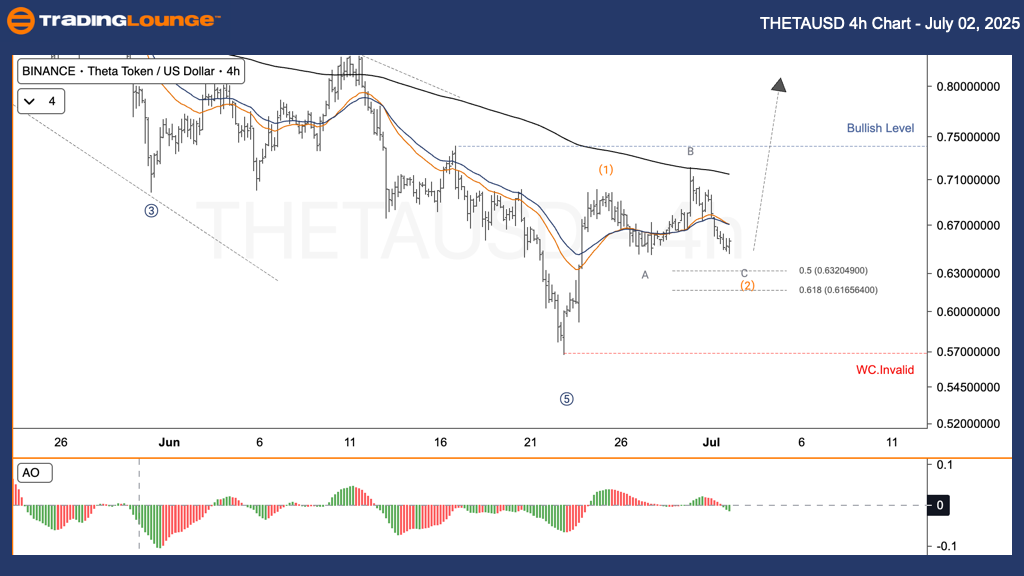
THETA/USD – Elliott Wave technical analysis – Four-hour chart
-
Function: Follow Trend
-
Mode: Motive
-
Structure: Impulse
-
Position: Wave 5
-
Next Direction: Higher Degrees
-
Invalidation Level: Not specified
Market overview
Similar to the daily chart, the 4-hour chart confirms that THETAUSD may have concluded a significant downward correction. The price is now forming wave (2), creating a base from which wave (3) might begin to rise.
Trading strategy
For short-term traders (swing trade):
-
Buy zone: Look to buy on a dip around 0.6200 USD.
-
Stop loss: Implement risk controls with a stop-loss set below 0.5600 USD.
Theta Token Elliott Wave technical analysis [Video]
Author

Peter Mathers
TradingLounge
Peter Mathers started actively trading in 1982. He began his career at Hoei and Shoin, a Japanese futures trading company.


