Theta Price Prediction: THETA aiming to hit a new all-time high at $0.80
- THETA is currently trading at $0.765 after a notable breakout from a symmetrical triangle pattern.
- Bulls still need to hold a crucial support level to continue with the upside price action.

THETA hit its all-time high at $0.79 on September 30. The digital asset is up by more than 2,000% since the low at $0.03 in March 2020.
THETA is one of the best-performing assets in 2020
For the most part, THETA has been flat and trading sideways from 2018 until February 2020. In the last seven months, THETA has managed to see a vast $600 million growth in market capitalization.
THETA/USDT daily chart
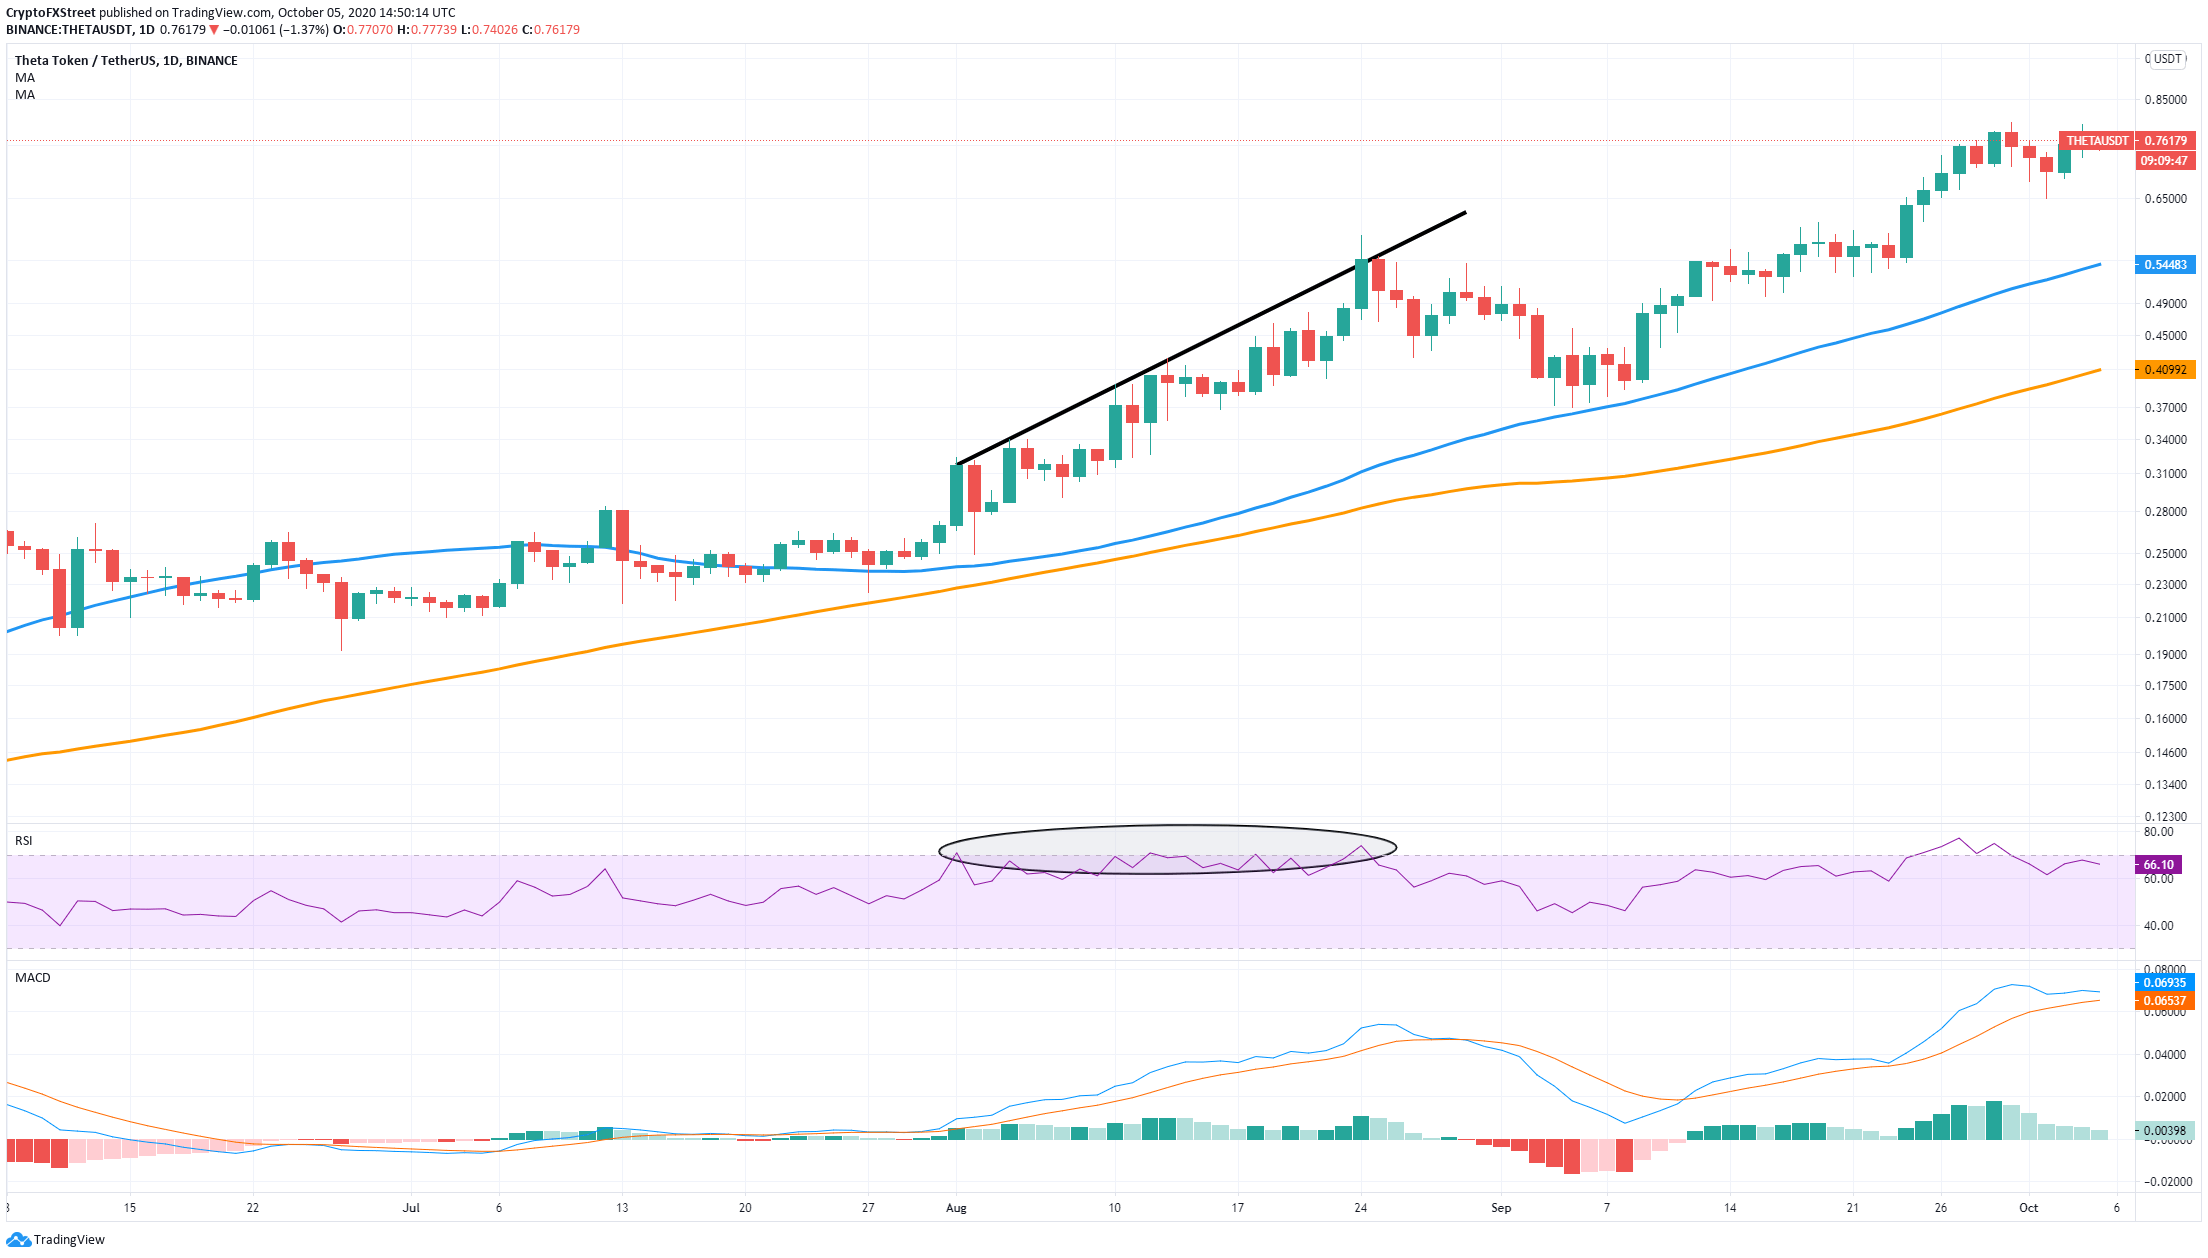
The daily chart is in favor of the bulls as THETA has been trading inside an uptrend. The 50-SMA and the 100-SMA were turned into support levels around April 2020 and held strong since then.
Although the daily RSI is currently on the verge of being overextended, history shows that it won’t stop THETA price from climbing further. From August 1 to August 24, the RSI was overextended or close to it on several occasions; however, the price continued climbing from $0.24 to $0.58.
THETA/USDT 15-minute chart
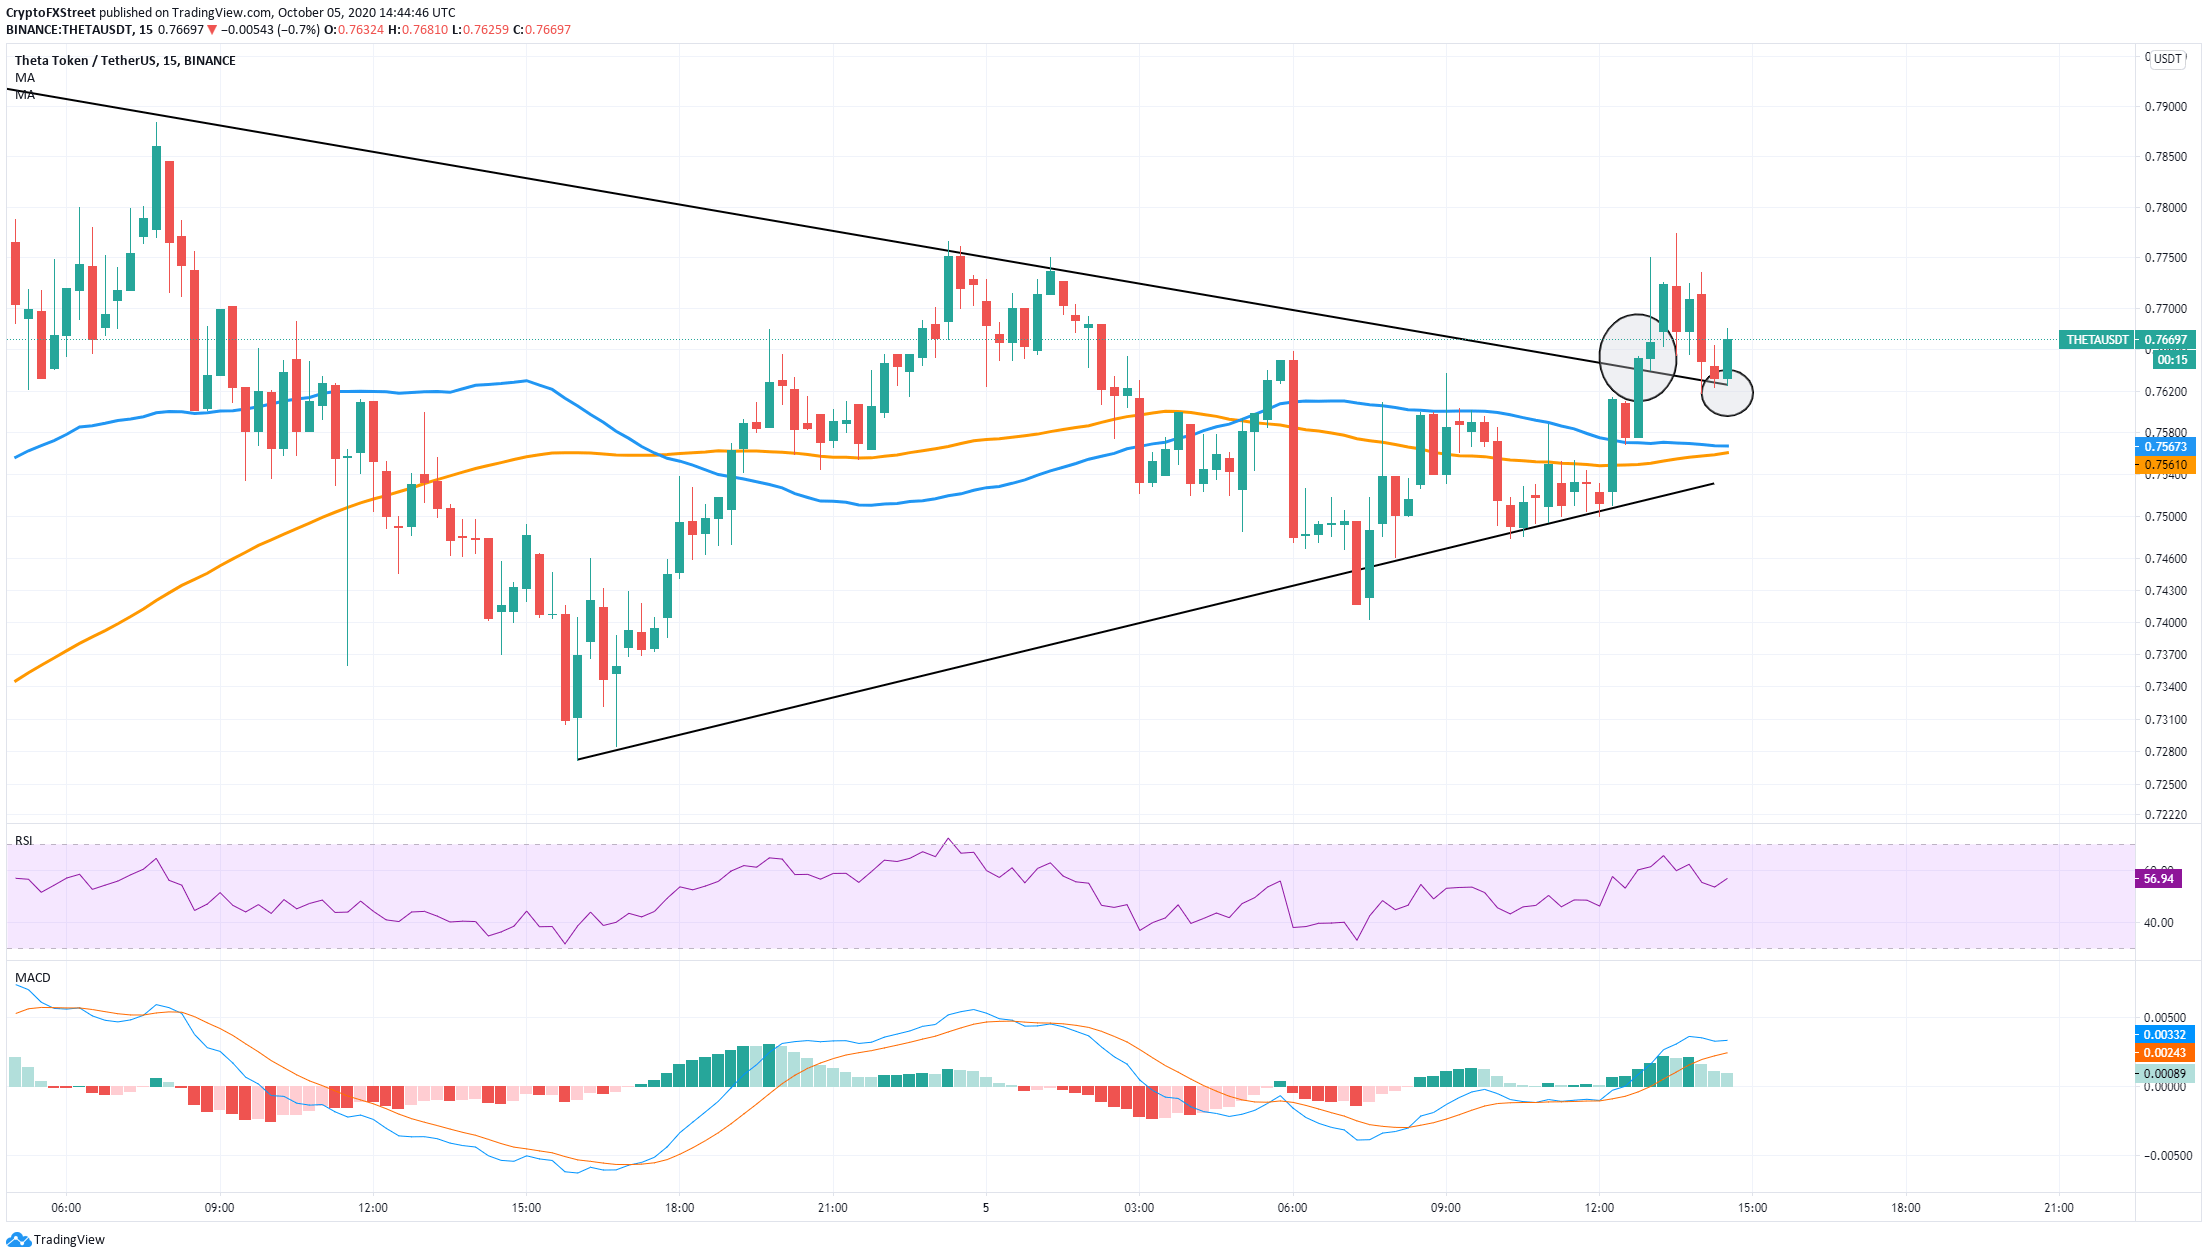
On a shorter time-frame, we can see a decisive breakout above a symmetrical triangle pattern. However, the price did get rejected at $0.777, and it’s now looking to re-test the upper trendline. If bulls can successfully defend the trendline level, the next price target for THETA would be $0.80.
On the other hand, a breakout below the lower trendline into a loss of both the 50-SMA and the 100-SMA at around $0.75 would shift the odds in favor of the bears.
THETA New Addresses Chart
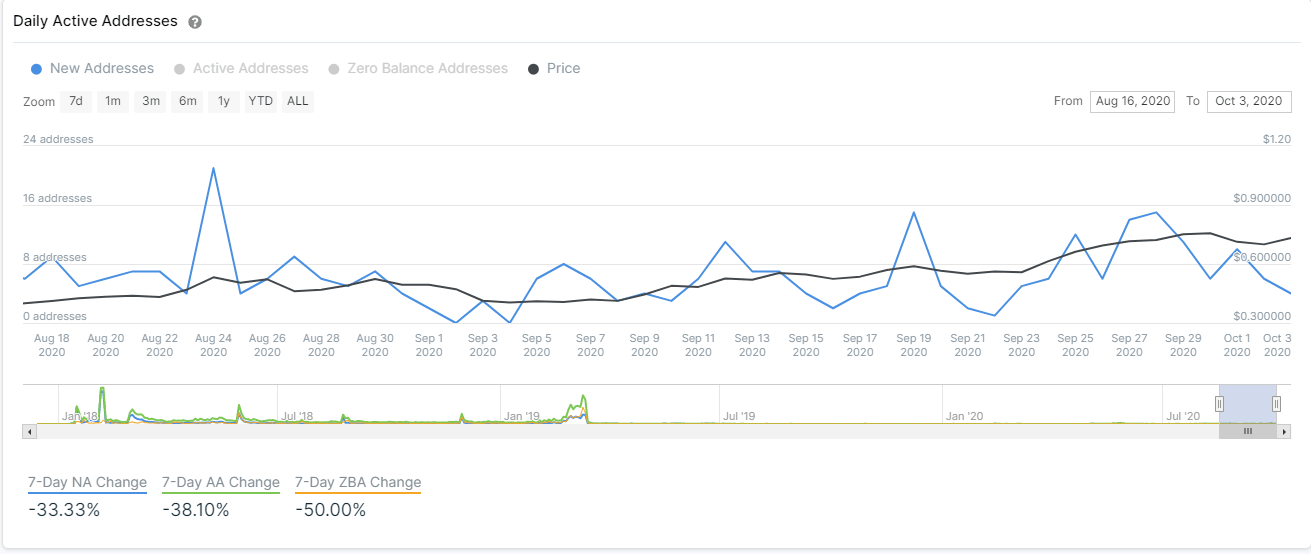
Looking at the chart with new THETA addresses that have joined the network, we see a notable decrease in growth over the past week, from a peak of 15 new addresses on September 28 to only 4 currently. This would indicate that the interest in the digital asset is lower, despite the recent bullish breakout.
Author

Lorenzo Stroe
Independent Analyst
Lorenzo is an experienced Technical Analyst and Content Writer who has been working in the cryptocurrency industry since 2012. He also has a passion for trading.


