|

Theta Elliott Wave technical analysis [Video]

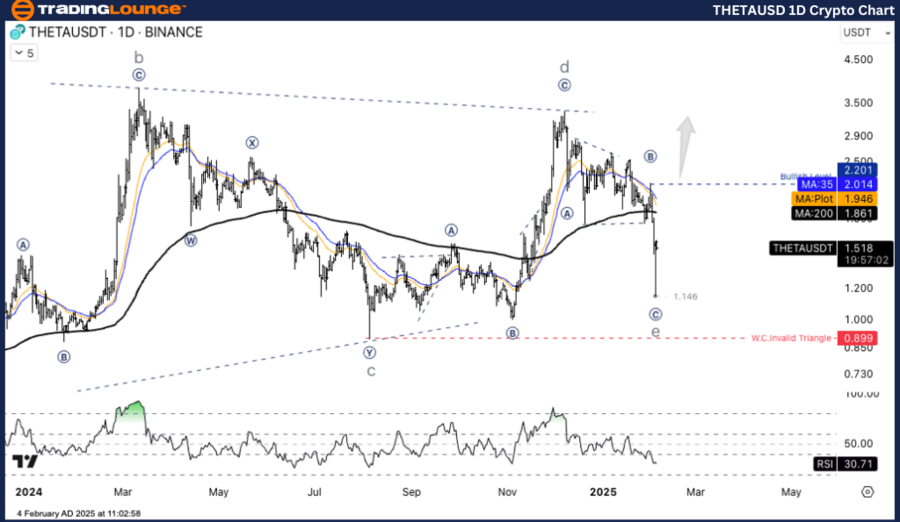
THETA/USD Elliott Wave Technical Analysis 

Function: Counter trend.

Mode: Corrective.

Structure: Zigzag.

Position: Wave((C)).

Direction next higher degrees: Wave E of Triangle.

Theta/ US Dollar (THETA/USD) Trading Strategy: The structure of the ABCDE Triangle is complete, with point E being the latest low, which may end the correction and prepare to enter a new uptrend. The low of Wave C is at around 0.899 USD, which acts as a critical support (W.C. Invalid Triangle).

 Trading strategies

Buy strategy (Long position):

  • Waiting for confirmation of a reversal above 2.187 USD.

Risk management:

  • The low of Wave C is around 0.899 USD which acts as a critical support (W.C. Invalid Triangle).
Chart

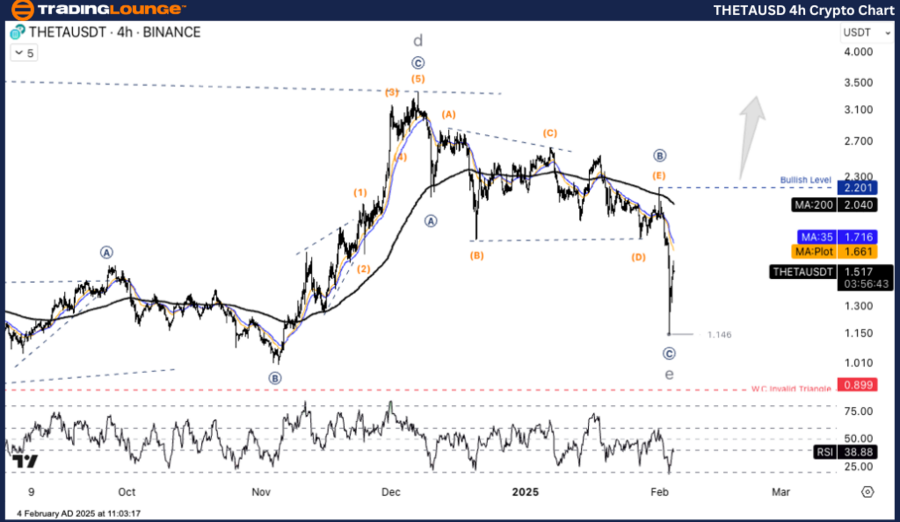
THETA/USD Elliott Wave technical analysis 

Function: Counter trend

Mode: Corrective

Structure: Zigzag

Position: Wave((C))

Direction Next higher Degrees: Wave E of Triangle

Theta/ US Dollar (THETA/USD) trading strategy: The structure of the ABCDE Triangle is complete, with point E being the latest low, which may end the correction and prepare to enter a new uptrend. The low of Wave C is at around 0.899 USD, which acts as a critical support (W.C. Invalid Triangle).

Trading strategies

Buy strategy (long position):

  • Waiting for confirmation of a reversal above 2.187 USD.

Risk management:

  • The low of Wave C is around 0.899 USD which acts as a critical support (W.C. Invalid Triangle).
Theta

Theta Elliott Wave technical analysis [Video]

Author

Peter Mathers

Peter Mathers

TradingLounge

Peter Mathers started actively trading in 1982. He began his career at Hoei and Shoin, a Japanese futures trading company.

More from Peter Mathers
Share:

Editor's Picks

XRP holds $1.40 amid ETF inflows and stable derivatives market

Ripple trades under pressure, with immediate support at $1.40 holding at the time of writing on Tuesday. A recovery attempt from last week’s sell-off to $1.12 stalled at $1.54 on Friday, leading to limited price action between the current support and the resistance.

Crypto Today: Crypto market holds $2.4 trillion as bearish sentiment persists around Bitcoin, Ethereum, XRP 

The Crypto King, Bitcoin, is constrained below $70,000, with the price holding around $69,000. Altcoins, including Ethereum and Ripple, exhibit technical weakness but are holding above key support levels at $2,000 and $1.40, respectively.

Aster tests resistance as whale activity, perpetuals volume surge

Aster (ASTER) edges higher by over 7% at press time on Thursday, crossing above its 200-period Exponential Moving Average (EMA) on the 4-hour chart while testing a long-term resistance trendline on the daily.

Bitcoin slips below $69,000 as crypto market shows cautious stabilization

Bitcoin price is nearing the lower consolidation boundary, trading below $69,000 at the time of writing on Tuesday. A breakdown below this key level would suggest a correction toward $60,000. However, institutional and corporate demand support a short-term stabilization in BTC.

Bitcoin Price Annual Forecast: BTC holds long-term bullish structure heading into 2026

Bitcoin (BTC) is wrapping up 2025 as one of its most eventful years, defined by unprecedented institutional participation, major regulatory developments, and extreme price volatility.

Bitcoin: The worst may be behind us

Bitcoin (BTC) price recovers slightly, trading at $65,000 at the time of writing on Friday, after reaching a low of $60,000 during the early Asian trading session. The Crypto King remained under pressure so far this week, posting three consecutive weeks of losses exceeding 30%.