The strongest sell signal for TRON price is the one nobody is talking about
- TRX price shows strong selling pressure on the volume indicator.
- Tron printed a shooting star pattern on the 4-day chart.
- Invalidation of the bearish thesis is a close above $0.092.

Tron price shows significant sell signals on higher time frames. Traders should be careful.
Tron price shows a Wyckoff distribution pattern
Tron price is currently trading at $0.08 as the crypto market as a whole is producing a stalemate this Tuesday. Illiquid market days usually provide investors time to review cryptocurrencies in search of subtle trend changes and anomalies. When reviewing the TRX price, the 4-day chart shows smart money’s hands are heavily involved with bearish confidence.
Tron price produced a shooting star pattern on the 4-day chart, which was accompanied by the highest historical volume to date according to Ku-Coin Exchange’s Volume Profile indicator. Such a large increase in transactions with little price movement to show for it is a typical anomaly that many technical analysts refer to as a Wycoff distribution pattern. If the technicals are correct, highly leveraged institutional traders will not release their sell orders until TRX price reaches the $0.05 liquidity zone.
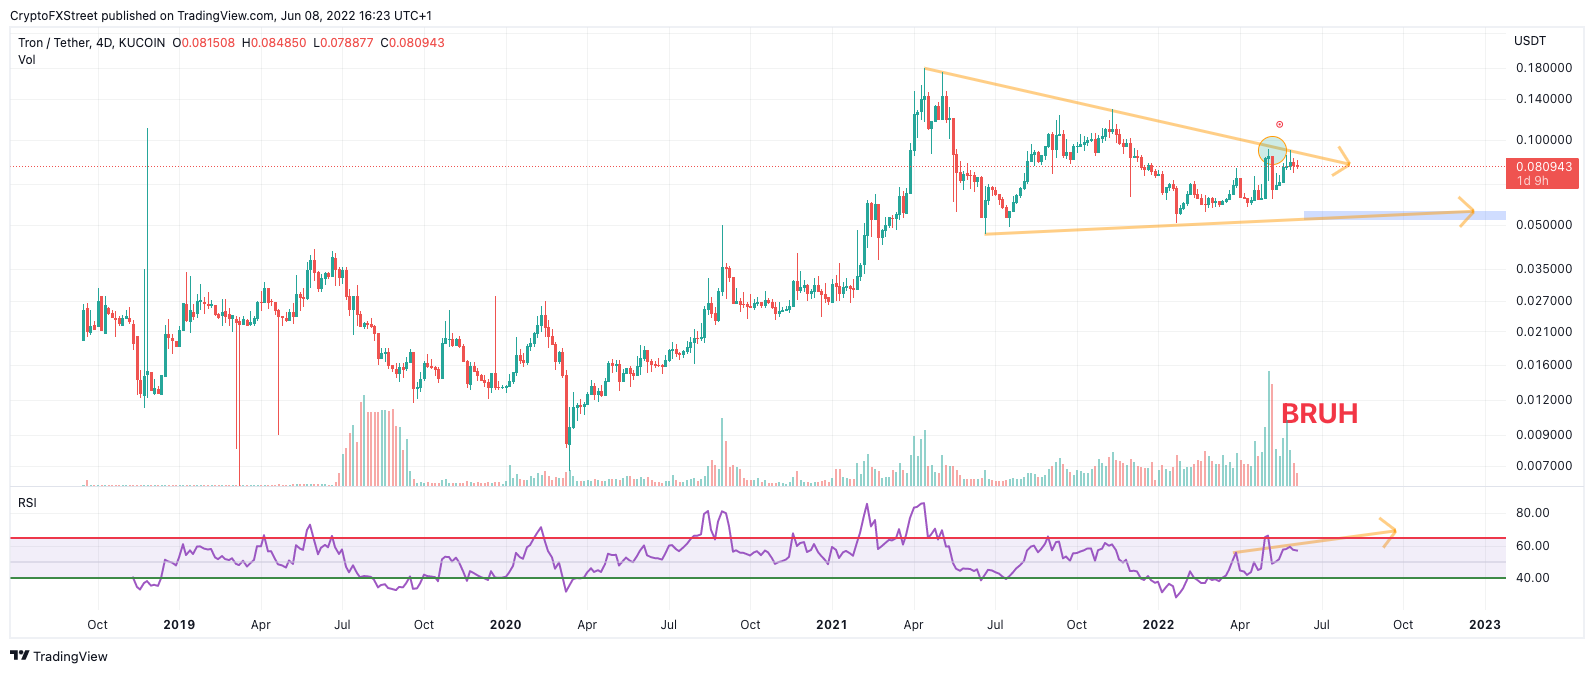
TRX/USDT 4-Day Chart
Invalidation of the bearish thesis is a closing candle above the shooting star pattern at $0.092. If the bulls can produce said price action, a rally towards $0.12 could occur, resulting in a 50% increase from the current Tron price.
Author

Tony M.
FXStreet Contributor
Tony Montpeirous began investing in cryptocurrencies in 2017. His trading style incorporates Elliot Wave, Auction Market Theory, Fibonacci and price action as the cornerstone of his technical analysis.


