- Tezos price set up a bullish formation over the weekend.
- XTZ price is taking a turn for the worse, set to turn into a bearish breakout.
- Expect to see at least a 15% decline in value with year-to-date lows at risk.
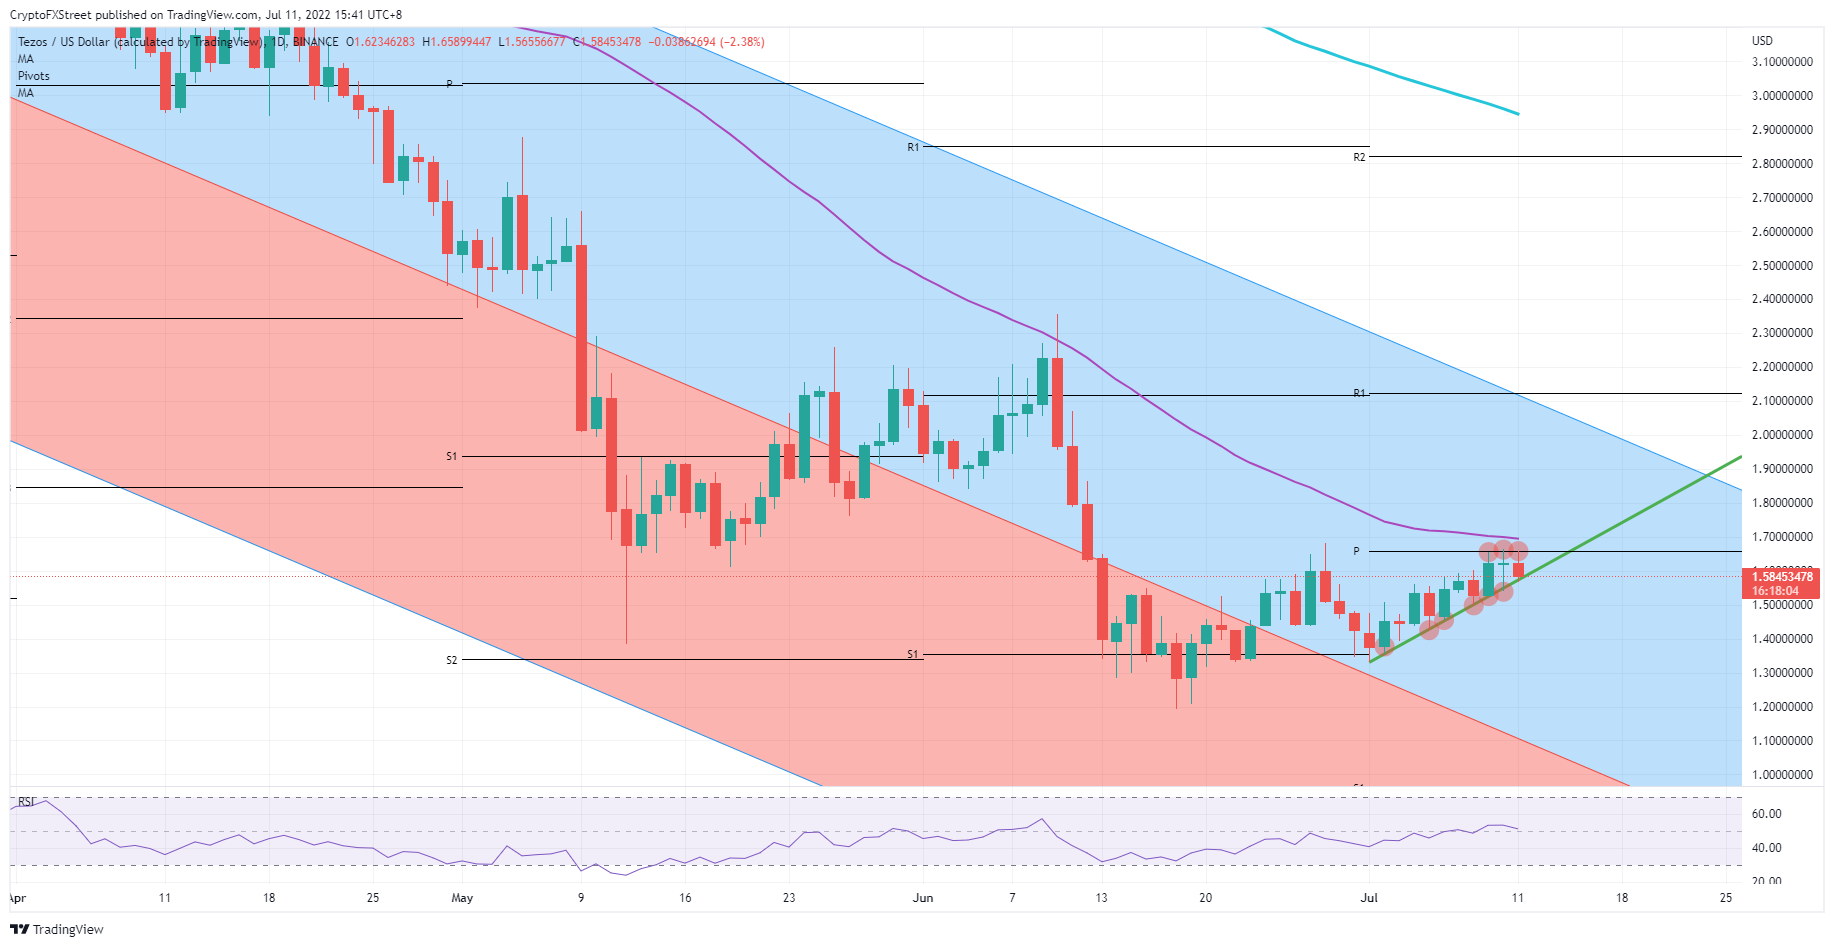
Tezos (XTZ) price held some good cards over the weekend as a bullish triangle was underway with the monthly pivot at $1.66 and a technical moving average just above set for the taking. The bullish setup is vanishing as sentiment got a turn on Monday morning, with ASIA PAC in deep negative numbers as China has locked down a few big-city blocks in Shanghai, adding to more supply chain issues. Add that to the energy crunch in Europe and speculation on higher inflation in the US and you see the tone setting for a bear market where cryptocurrencies are the least favourite segment investors want to be in.
XTZ faces headwinds from global markets
Tezos price has been trying to break above the base of the bullish triangle at $1.66, which is the monthly pivot for July at that level. Unfortunately, bulls needed three tests and failed, in the end, to break above the level and try to attack the 55-day Simple Moving Average (SMA) that comes in just above the pivot at $1.70. Seeing that XTZ price action is taking a step back, together with the significant drop in the stock market, expect this trade to wobble and possibly collapse.
XTZ price will signal the end of this bullish triangle when the green ascending trend line is broken to the downside. With six confirmed tests for support, this trend line is massively important, and thus when it breaks, will send a signal to traders that should not be ignored as a steamrolling reversal will happen. XTZ price will pare back all gains and drop back towards $1.30, erasing all gains on the docket for July, and could even overshoot towards $1.20, testing new lows for the year.
XTZ/USD Daily chart
With a correction this early in the week, a turnaround gets triggered often later in the week. That would mean that after this selloff, the worst is over for Tezos for this week, and it could only see a further squeeze to the upside with a break above the monthly pivot and the 55-day SMA. This would open some room for an extended area towards $2.10 with the monthly R1 resistance and the upper side of the longer-term trend channel in play to cap price action for now.
Information on these pages contains forward-looking statements that involve risks and uncertainties. Markets and instruments profiled on this page are for informational purposes only and should not in any way come across as a recommendation to buy or sell in these assets. You should do your own thorough research before making any investment decisions. FXStreet does not in any way guarantee that this information is free from mistakes, errors, or material misstatements. It also does not guarantee that this information is of a timely nature. Investing in Open Markets involves a great deal of risk, including the loss of all or a portion of your investment, as well as emotional distress. All risks, losses and costs associated with investing, including total loss of principal, are your responsibility. The views and opinions expressed in this article are those of the authors and do not necessarily reflect the official policy or position of FXStreet nor its advertisers. The author will not be held responsible for information that is found at the end of links posted on this page.
If not otherwise explicitly mentioned in the body of the article, at the time of writing, the author has no position in any stock mentioned in this article and no business relationship with any company mentioned. The author has not received compensation for writing this article, other than from FXStreet.
FXStreet and the author do not provide personalized recommendations. The author makes no representations as to the accuracy, completeness, or suitability of this information. FXStreet and the author will not be liable for any errors, omissions or any losses, injuries or damages arising from this information and its display or use. Errors and omissions excepted.
The author and FXStreet are not registered investment advisors and nothing in this article is intended to be investment advice.
Recommended Content
Editors’ Picks
XRP ruling by Judge Torres denied in Coinbase lawsuit, yet another blow to Ripple
XRP programmatic sales ruling by Judge Torres completely rejected by US Court in Coinbase lawsuit. US Court rejected Coinbase’ motion to dismiss SEC lawsuit, weighing heavily on Ripple’s legal battle.
Sushi price eyes $3 after clearing key weekly resistance level
Sushi price flips the $1.628 resistance level into a support floor after a month of struggle. A temporary retracement might be a good opportunity to accumulate SUSHI before a retest of $3. A breakdown of the $1.267 barrier would invalidate the bullish thesis.
Bitcoin Price Outlook: Will $150 billion bank Morgan Stanley send BTC to new ATH?
Bitcoin has recorded increased volatility this week, with most of BTC holders currently in profit. As market activity continues to grow with long-term holders now ramping up on distribution pressure, the pioneer crypto is bearing the brunt of growing overhead pressure.
Coinbase loses first round of battle against SEC
A day after the SEC filed a lawsuit against Binance last year, it went after Coinbase in a sign that the clampdown is extending to key players in the industry. The latest development in the matter is that the court has ruled in favor of the financial regulator, which means the case will continue.
Bitcoin: BTC may have recovered, but is it out of the woods?
Bitcoin’s (BTC) upward momentum has shown a significant decline for the past two weeks or so. This development led to a bearish signal on the weekly and an uncertain outlook on the monthly.