Tension Ramps up

The recent couple of days have turned the short-term outlook on its ear for some traders. The last couple of months have seemed like sooth sailing, not something that could be said about the Bitcoin market too many times in the past. Now, we get a different reading and some might say that the tide has turned. But you need to go deeper than that.
Bitcoin has gone up and the bulls are euphoric. This is a marked change from the recent weeks when there was little to nothing for Bitcoin aficionados to cheer to. The main question, however, remains: “Has anything changed?” With the recent appreciation, we could also ask: “Does this action change anything?” Is there anything that could drive the profits on our hypothetical speculative positions?
The move up is transpiring to the mainstream media. In an article on the CNBC website, we read:
After a sluggish start to the year, bitcoin started the month of July with a 12 percent rebound off of last week’s lows.
The cryptocurrency rose 4 percent Monday to near $6,550 as of 9:30 a.m. ET, hitting a high of $6,609.50, according to data from CoinDesk.
Last week, bitcoin skidded to its lowest level since November under $6,000, which traders attributed to CME futures contracts expiring and overall lackluster interest from new buyers. The world’s largest and first cryptocurrency has struggled from that lack of enthusiasm, and prices have dropped 52 percent since January, according to CoinDesk.
Actually, the article takes a sober approach, contrasting the recent action to the upside with the previous drop of 52%. So, even though the title might be implying a bullish change, the text offers a more balanced point of view, highlighting the extent of the previous declines. At a risk of stating the obvious, Bitcoin’s recent rally pales in comparison with the previous depreciation.
Another point worth stressing is that even if you look at Bitcoin in a longer time horizon, like two or three years and are tempted to conclude that the currency is still up, consider the road you would have take had you bought Bitcoin at that time. To call it a roller coaster would be an understatement. How many investors would have been able to hold on to the currency through all the lows? And even if it’s not fancy to say this, Bitcoin’s volatility is something to keep in mind, something that might potentially get out of hand very quickly. That’s why being ultra bullish or bearish on this market all the time is not a great idea.
Back Above April 1 Low
On BitStamp, we are seeing a rebound from the recent low below $5,800. In particular, this rebound has brought Bitcoin above the level of the April 1 low. So, it’s tempting to see this action as a bullish turnaround.
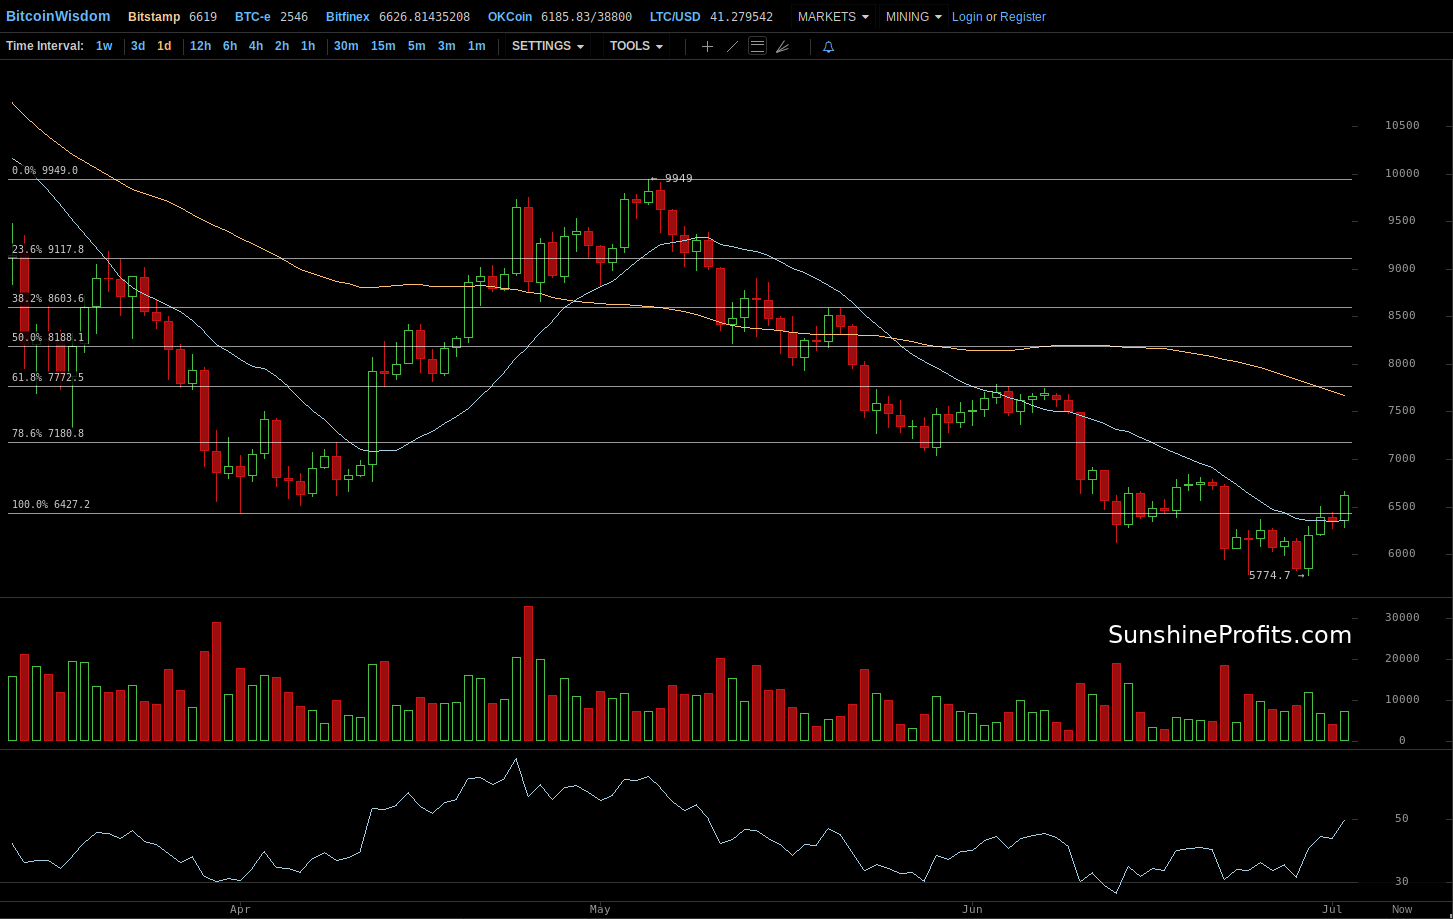
We’re not in the business of choosing tempting outcomes, though. Actually, we’re very interested in seeing situations which look tempting one way but turn out to be exactly the opposite of what can be seen on the surface. And right now, if we’re not seeing such a situation, then at least we’re seeing one which could very quickly evolve to be one.
The short-term bullish outlook is not confirmed by daily closes. Neither is it confirmed by the volume that has accompanied the move up. So, in spite of the flashy nature of the move, we haven’t really seen much in the way of a bullish confirmation. The move above the April 1 low is the main bullish hint and it is not even confirmed yet.
Given the extent of the declines we can see on the chart above, it is only natural for Bitcoin to rebound and go up for some time before turning back South. This is further supported by the fact that the RSI is now back around 50, which suggests that the currency is not in an extreme position, so a move to the downside wouldn’t necessarily exhaust the selling power.
Limited Sign
On the long-term Bitfinex chart, we see that the currency is not in an extreme position either. Taking a look at the long-term chart and seeing Bitcoin in perspective might decisively change one’s outlook. Even if the current action seems exciting, it is nothing extraordinary compared with previous corrections in the currency.
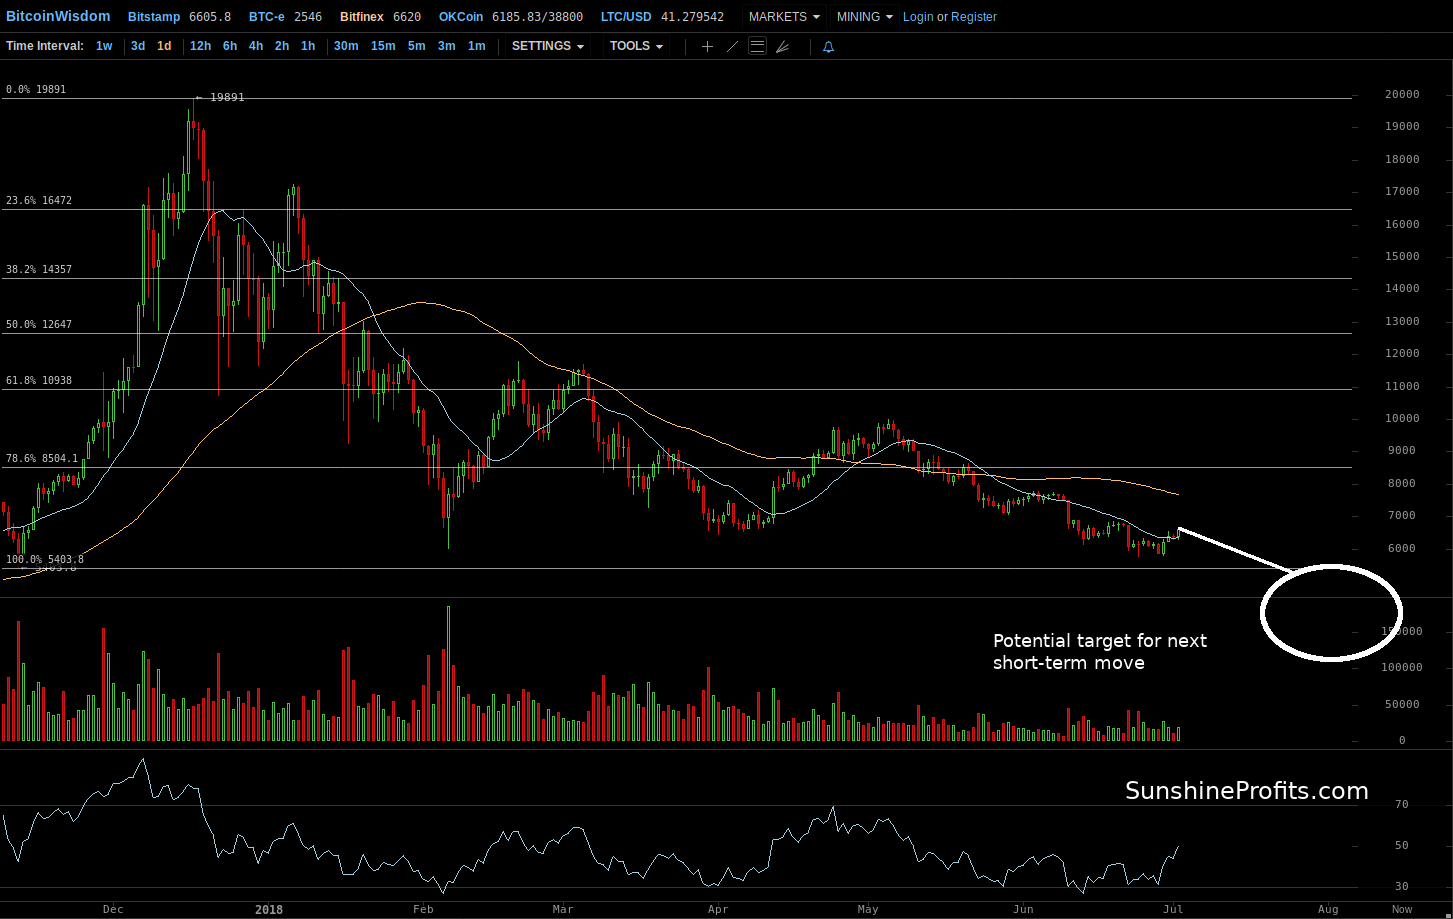
Bitcoin is still above the level from which the bulk of the rally to $20,000 occurred. This level is at around $5,400, not very far from where the currency is trading at the moment of writing these words. So, there’s no bullish indication based on this level.
The one bullish indication we’re seeing at the moment is the fact that Bitcoin went below the level of the February bottom ($6,000) and came back above this level. This is a bullish indication and one based on a very significant support level – the February bottom was spectacular in terms of the volume. So, which one is more important – the lack of a range of bullish indications or the presence of one indication based on an important level?
Our answer here is that we might be seeing a short-term correction in the Bitcoin market. This might be why the currency is above the February low. At the same time, we haven’t seen multiple confirmed bullish indications, so the overall outlook remains bearish. A move up at this time is nothing out of the usual, given the extent of the previous declines. Betting on higher prices at this time, or even getting out of the shorts doesn’t seem the way to go as the volatility might rise rapidly and if Bitcoin goes back down, there might not be time to get back on the short side of the market.
The one thing that’s worth monitoring at this time is the volume in Bitcoin – if we see a further move up confirmed by the volume, we might change our short-term outlook but we’re not seeing this at the moment and the outlook remains bearish.
Summing up, the situation is very tense but the outlook remains bearish at the moment.
If you have enjoyed the above analysis and would like to receive free follow-ups, we encourage you to sign up for our daily newsletter – it’s free and if you don’t like it, you can unsubscribe with just 2 clicks. If you sign up today, you’ll also get 7 days of free access to our premium daily Gold & Silver Trading Alerts. Sign me up!
Want free follow-ups to the above article and details not available to 99%+ investors? Sign up to our free newsletter today!
Author

Mike McAra
Sunshine Profits
Mike is a quantitative analyst focused on the economic reality, not theoretical models. His investment thinking is grounded on empirical evidence and common sense.


