Swipe Price Prediction: SXP purifies excesses, primed for a fresh 40% rally
- Swipe price correction stalls at the 50% retracement level twice in three days.
- Wide price swings still respecting the 50-day simple moving average (SMA).
- SXP IOMAP data highlights significant resistance around the psychologically important $4.

Swipe price declined over 40% from April 10 before capturing support at the 50% retracement of the rally beginning in December 2020, and buying pressure carried prices to close above the 50-day SMA. There is credible technical resistance above for SXP, and the latest IOMAP data reinforces those levels.
Swipe price buzzword is “bottom”
A new rally is going to be met with notable resistance just above the current price. According to Intotheblock In/Out of the Money Around Price data, 26 addresses purchased 28.3 million SXP between $4.01 and $4.13. The price range corresponds with the February and March highs.
In contrast, there is no measurable support down to $3.22, which is close to the 50% retracement level, and it should prompt speculators to consider another retest of the $3.08.
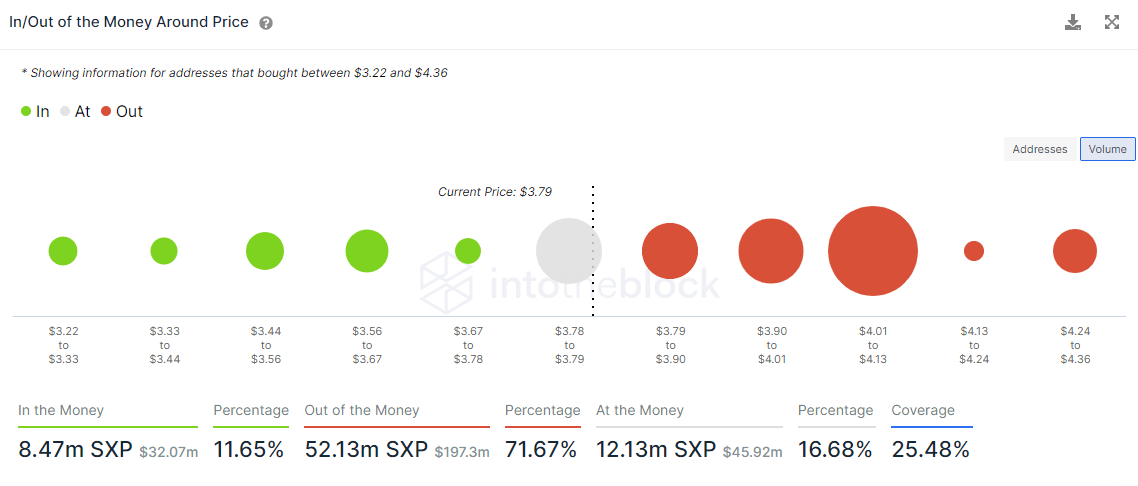
SXP IOMAP data
The combination of heavy resistance just over $4 and no support down to $3.22 does raise the probability of another test of the 50% retracement of the rally from the December 2020 low before SXP can successfully rally to new highs. The price volatility could be organic or part of another downswing for cryptocurrencies in general.
A daily close above the March high at $4.22 will be the tell that SXP is ready to launch an assault on new highs for possibly the third time in April. After reaching new highs, market participants should target the 138.2% extension of the 2020 bear market at $6.89 and then the 161.8% extension at $7.97.
To add, it is vital to monitor the daily Relative Strength Index (RSI) when new price highs are printed because it failed to confirm the highs earlier in April, creating a bearish momentum divergence that forecasted the correction.
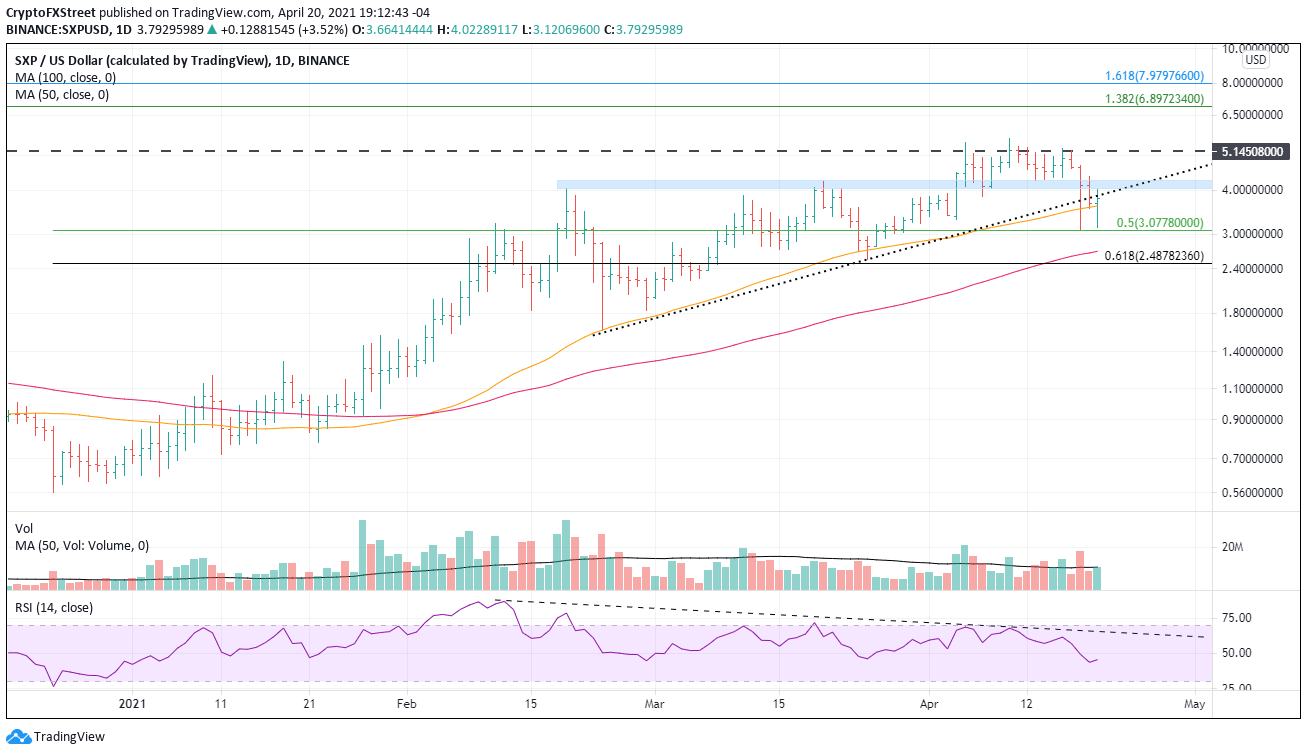
SXP/USD daily chart
The market is still in limbo, and despite some bullish price action, it is necessary to be prepared for the downside. A daily close below $3.07 will introduce a decline to the 100-day SMA and a test of the March 25 low at $2.53.
Author

Sheldon McIntyre, CMT
Independent Analyst
Sheldon has 24 years of investment experience holding various positions in companies based in the United States and Chile. His core competencies include BRIC and G-10 equity markets, swing and position trading and technical analysis.