Swipe Price Forecast: SXP opportunities multiply with a retest of $1.34
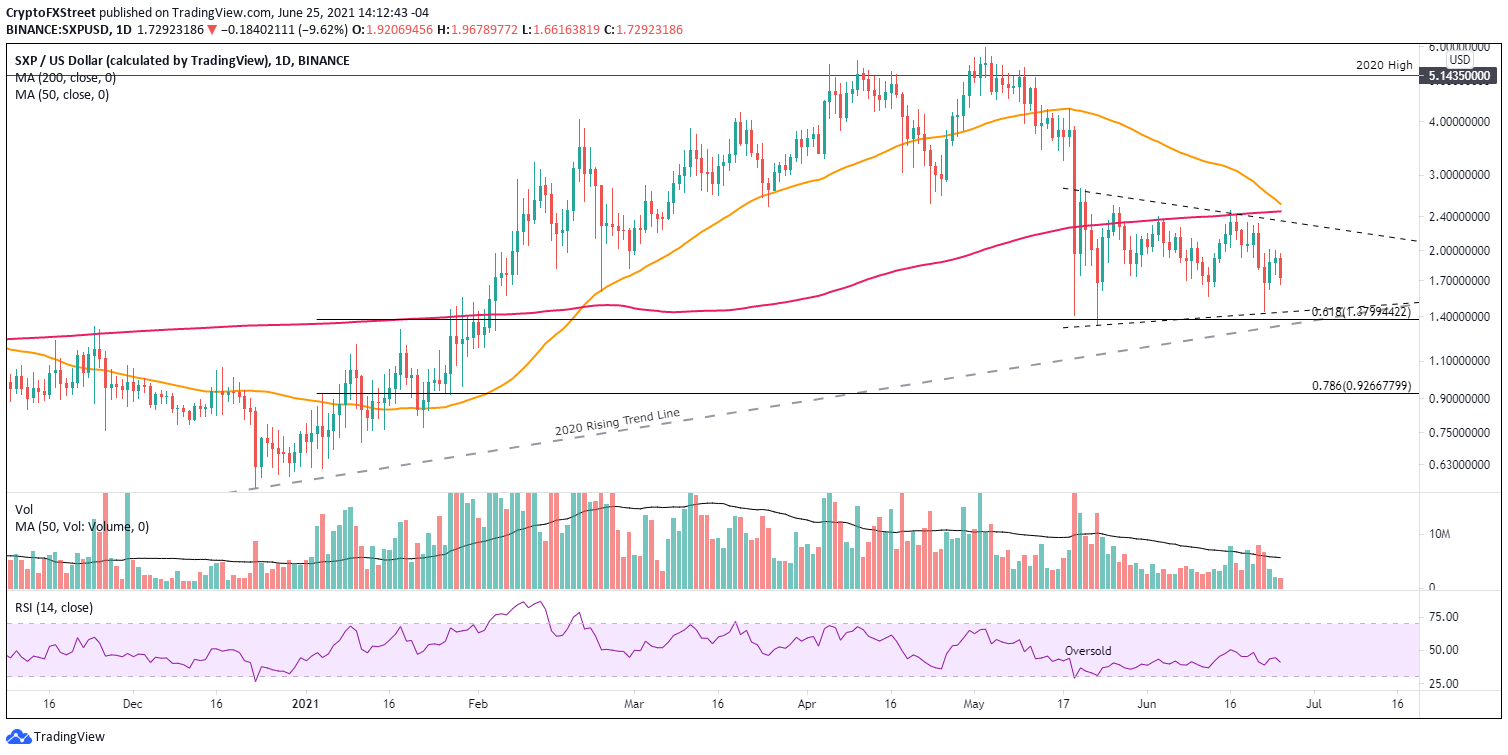
- Swipe price continues forming a symmetrical triangle with the May 23 lows still intact.
- SXP will trigger a bearish Death Cross in the next few days, presenting a new challenge for investors.
- 2020 rising trend line rests below the price, offering a reinforcement against any extended decline for SXP.

Swipe price rebound from the June 22 low was not accompanied by a resounding level of buying commitment from investors is being shown today as SXP drops 11% at the time of writing. The availability of the symmetrical triangle trend line, the 61.8% Fibonacci retracement level of the December 2020-May 2021 rally and the 2020 rising trend line do project a sturdy level of support if selling accelerates. For now, investors should remain on the sidelines until there is price structure clarity.
Swipe price challenged by an uncertain outlook for altcoins
Swipe price crumbled 77% from the May 3 high of $5.97 to the May 23 low of $1.33, highlighted by a 48.42% decline on May 19. The decline was the largest daily decline since March 12, 2020. Moreover, it left SXP below the 200-day SMA where the altcoin has remained since May 23 low.
Swipe price has not played the role of relative strength leader over 2021, particularly during the period following June 23. The outlook for SXP remains clouded, but precise support and resistance levels facilitate investor’s trading programs with distinguishable pivot points, whether from the long or short side.
With a death cross creeping into the picture, Swipe price could see a renewal in selling, but only a daily close below the 2020 rising trend line at $1.34 and the May 23 low of $1.33 would alter the prevailing SXP thesis that a firm low has been printed.
An accelerated push below $1.33 leaves SXP vulnerable to a more significant decline, potentially to the 78.6% retracement of the December 2020-May 2021 rally at $0.92.
SXP/USD daily chart
Since the price action has been relatively loose since May 23, it is difficult to establish a clear long entry on the upside until the symmetrical triangle’s upper trend line at $2.35. Still, the breakout may not last long as the 200-day SMA at $2.46 and 50-day SMA at $2.56 converge to establish meaningful resistance. After $2.56 on a daily closing basis, Swipe price is presented with a clear path to the all-time high of $5.97.
To capture a rally towards the abovementioned levels, they should evaluate the SXP intra-day charts searching for earlier pivot points.
As the Swipe price structure currently dictates, combined with the new weakness in the cryptocurrency complex, SXP speculators should welcome any test of the $1.34-$1.44 price range as an opportunity, thereby multiplying upside potential.
Author

Sheldon McIntyre, CMT
Independent Analyst
Sheldon has 24 years of investment experience holding various positions in companies based in the United States and Chile. His core competencies include BRIC and G-10 equity markets, swing and position trading and technical analysis.


