Sui Price Forecast: Sui eyes triangle fallout below $3 as Open Interest, TVL plunge
- Sui falls under $3 for the second time this month, posting on Friday losses for a third straight day.
- Sui’s Open Interest falls to the lowest level in a month as optimism wanes in the altcoin market.
- The technical outlook suggests increased downside risks with a potential triangle breakdown.

Sui (SUI) edges lower by over 5% at press time on Friday, concurrent with the broader crypto market crash due to the escalation of the conflict between Israel and Iran.
The sudden sell-off prints multiple bearish candles in the daily price chart, while Open Interest plummets to a level last seen in April. As risk-off sentiment prevails in the cryptocurrency market, the SUI price forecast indicates dire downside risk.
Optimism declines in Sui Derivatives
CoinGlass data shows that SUI Open Interest (OI) has declined by 14% to $1.20 billion over the last 24 hours. A sudden crash in OI aligns with the broader market sell-off and wipeout of bullish-aligned traders.
With increased volatility, the OI-weighted funding rates fluctuated multiple times over the last 24 hours. Currently, the funding rate is at 0.0024%, indicating a phase of increased bullish activity as rates are imposed on bulls to align swap and spot prices, which could result in a short-term recovery.
As SUI plummets, long liquidations surged to $12.63 million within 24 hours, while short liquidations stood at $766K. The imbalance in liquidations reinforces the bearish trend in motion, causing the long/short ratio to decline to 0.9369.
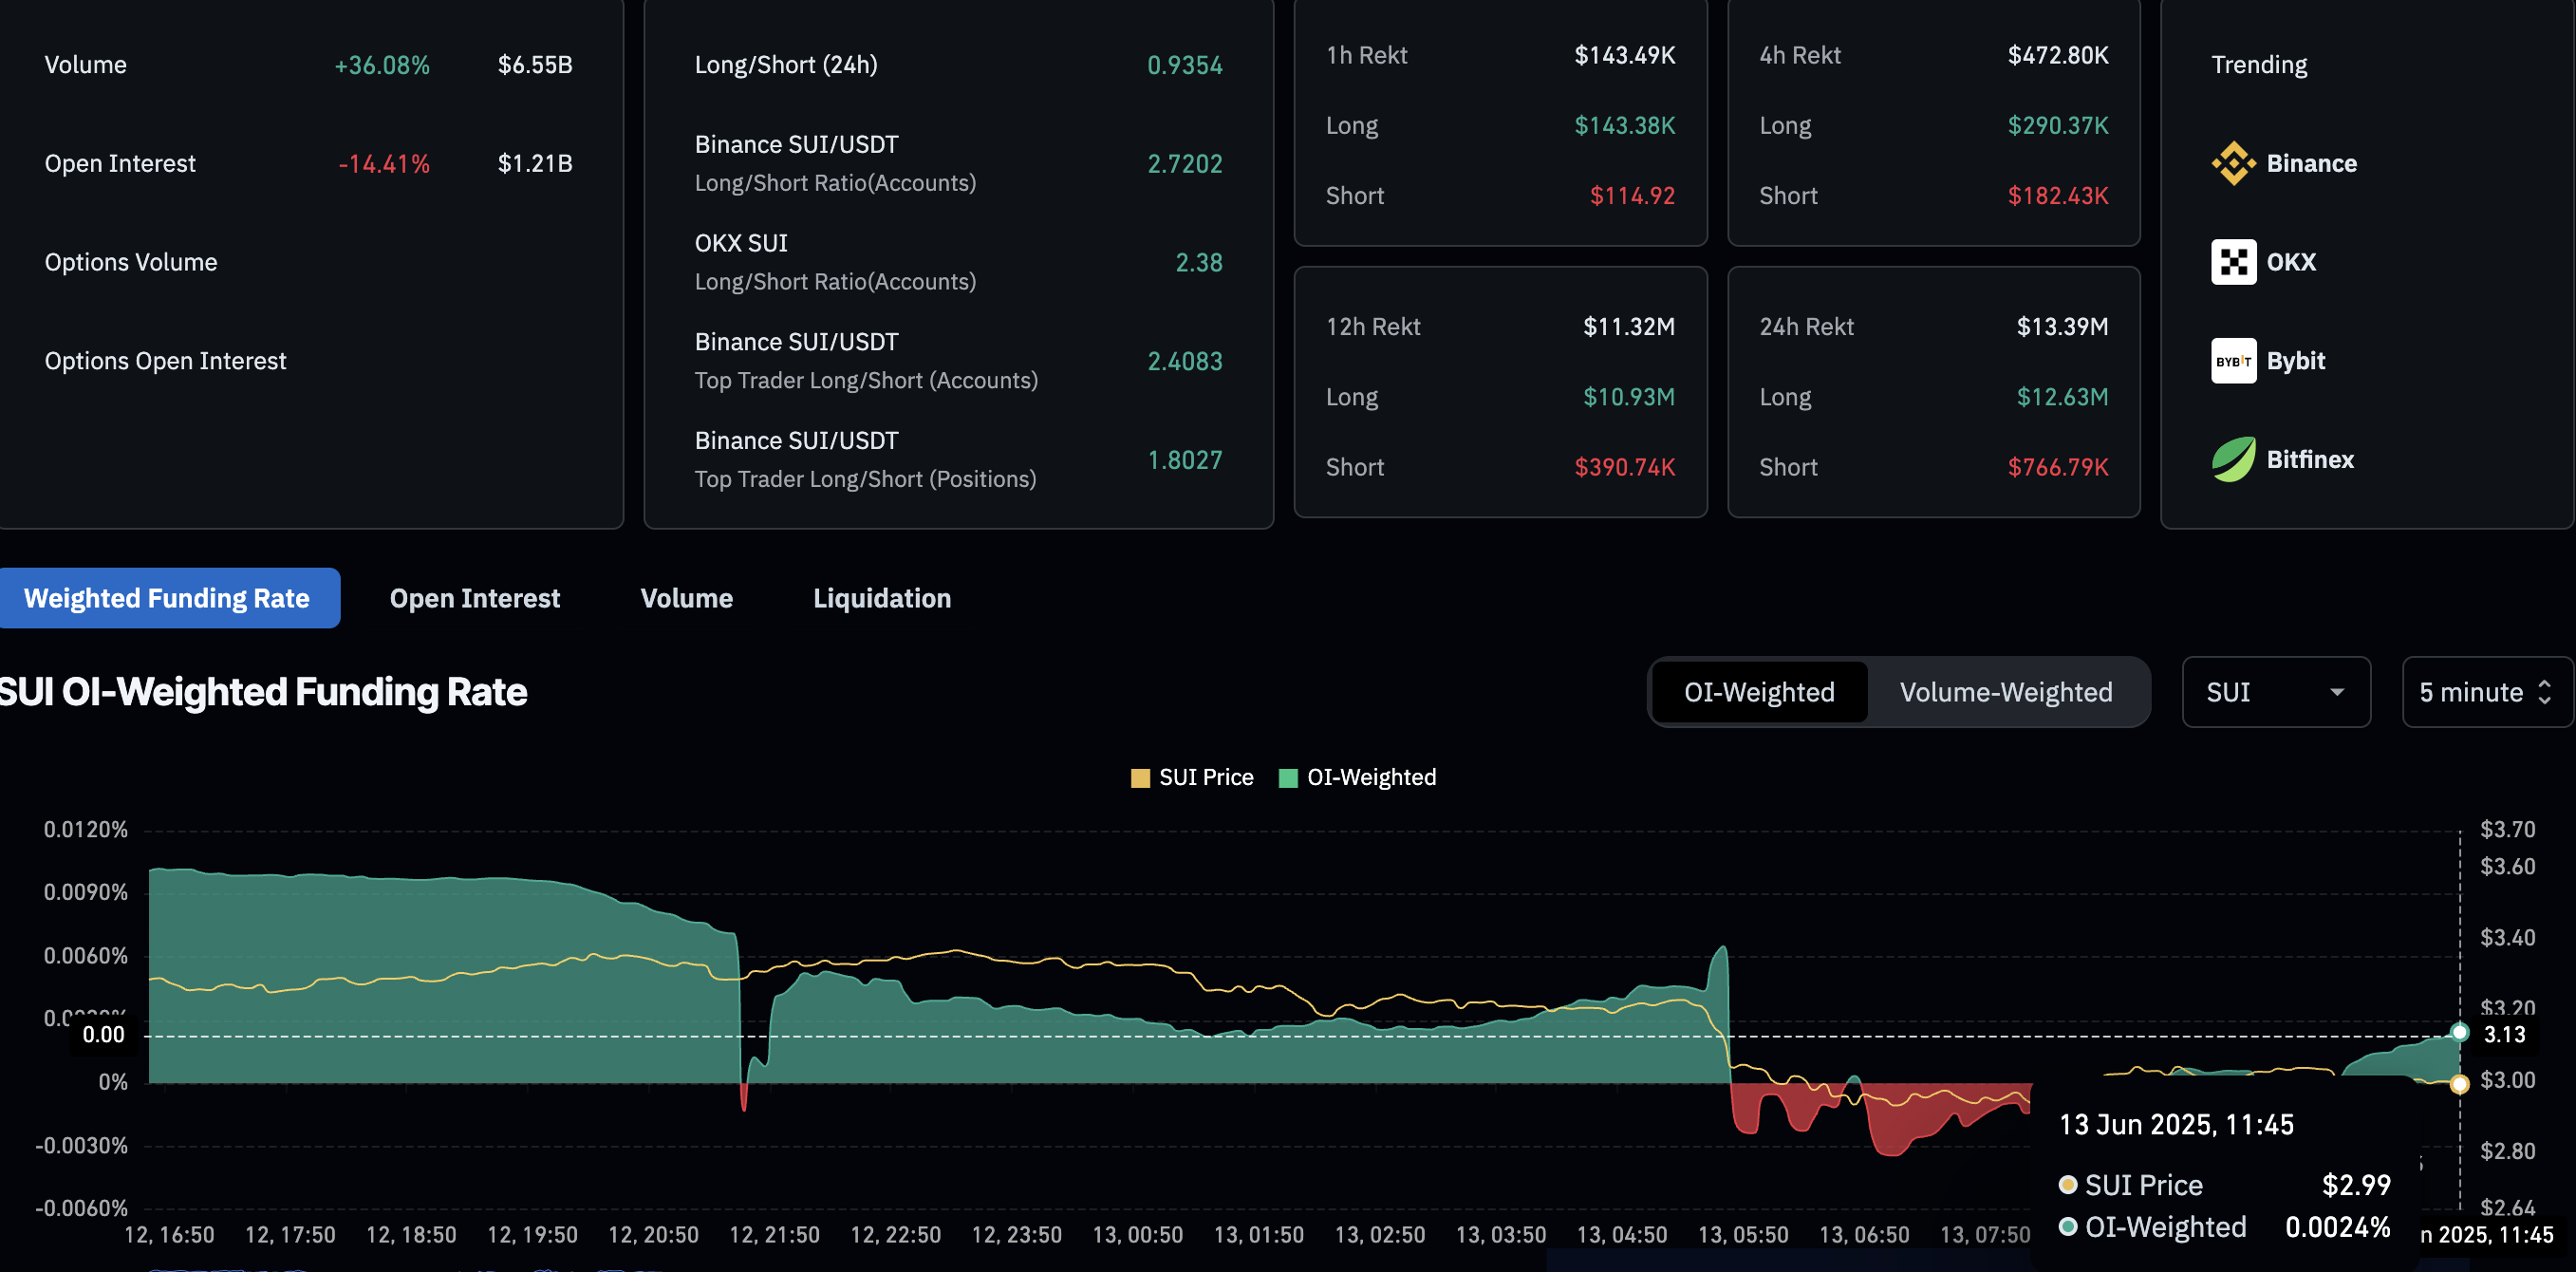
Sui derivatives. Source: Coinglass
The increased liquidations and declining open interest signal a surge in bearish sentiment in SUI derivatives.
Sui Network's TVL plunges
Sui’s Total Value Locked (TVL), which represents capital locked on the network to support Decentralized Finance (DeFi) services, has dropped to $1.783 billion, a 8.11% decrease in 24 hours. This suggests decreased activity.
The platform’s liquidity and the Decentralized Exchange (DEX) volume are on the rise. The stablecoin market capitalization of SUI has increased by 2.73% in the last 24 hours, reaching $1.145 billion.
Concurrent with the growth in liquidity, Sui’s daily DEX volume has remained above $300 million for the last four days.
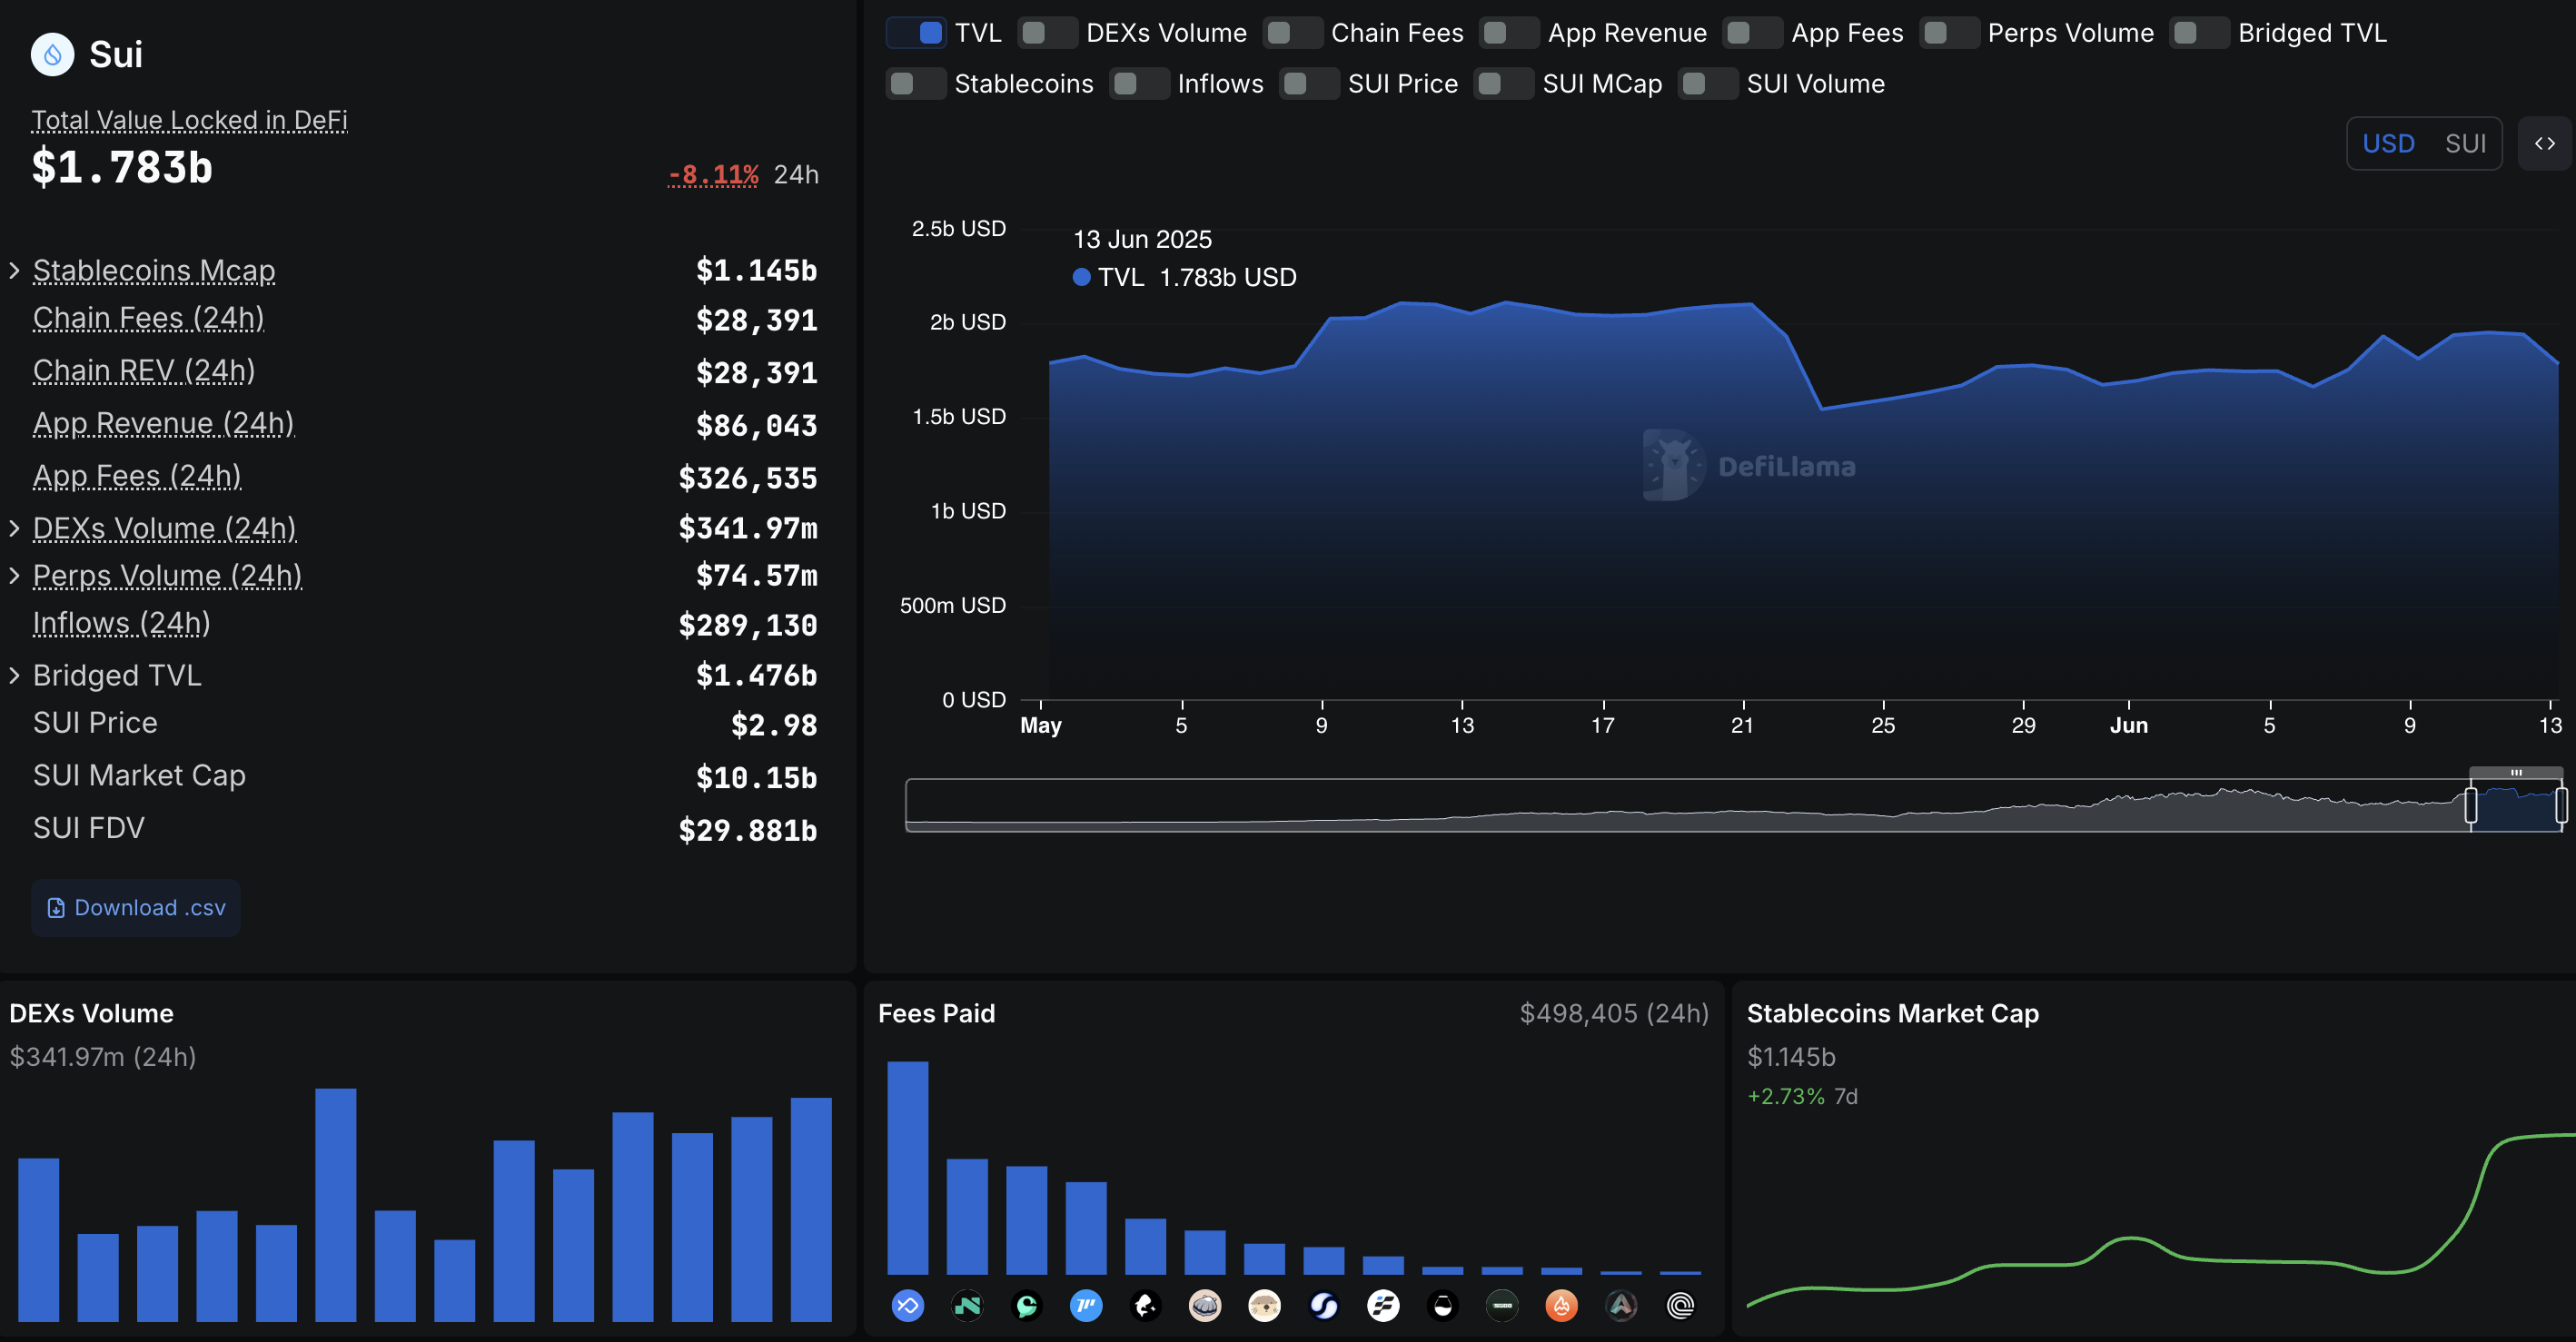
Sui's total value locked. Source: Coinglass
The improving DEX volume and stablecoin market capitalization signal underlying resilience amid the recent volatility hitting the network.
Sui risks triangle breakdown
Sui is down over 5% in the day at press time on Friday, testing a crucial support trendline formed by swing lows on April 8, April 16, and June 5. The recent reversal on June 5 failed to cross above the 50% Fibonacci level at $3.54, drawn from the all-time high price of $5.36 to the year-to-date low of $1.71.
A local resistance trendline formed by peaks on May 12, May 21, and June 5 converges with the support trendline to form a triangle pattern. Within the triangle, the recent price decline sweeps under the 200-day Exponential Moving Average near the $3.00 psychological level.
If SUI extends below the June 5 closing price of $2.92, it will mark the triangle breakdown. In such a scenario, the next support lies at $2.57, which aligns with the 23.6% Fibonacci level.
The Moving Average Convergence/Divergence (MACD) indicator reverses from its signal line on the daily chart, prolonging the declining trend. It also signals a new bearish histogram under the zero line, suggesting a correction ahead.
The Relative Strength Index (RSI) at 39 spikes lower below the neutral level, in line with the bearish trend in motion. Approaching the oversold zone, the indicator warns of a potential breakdown of the triangle pattern.
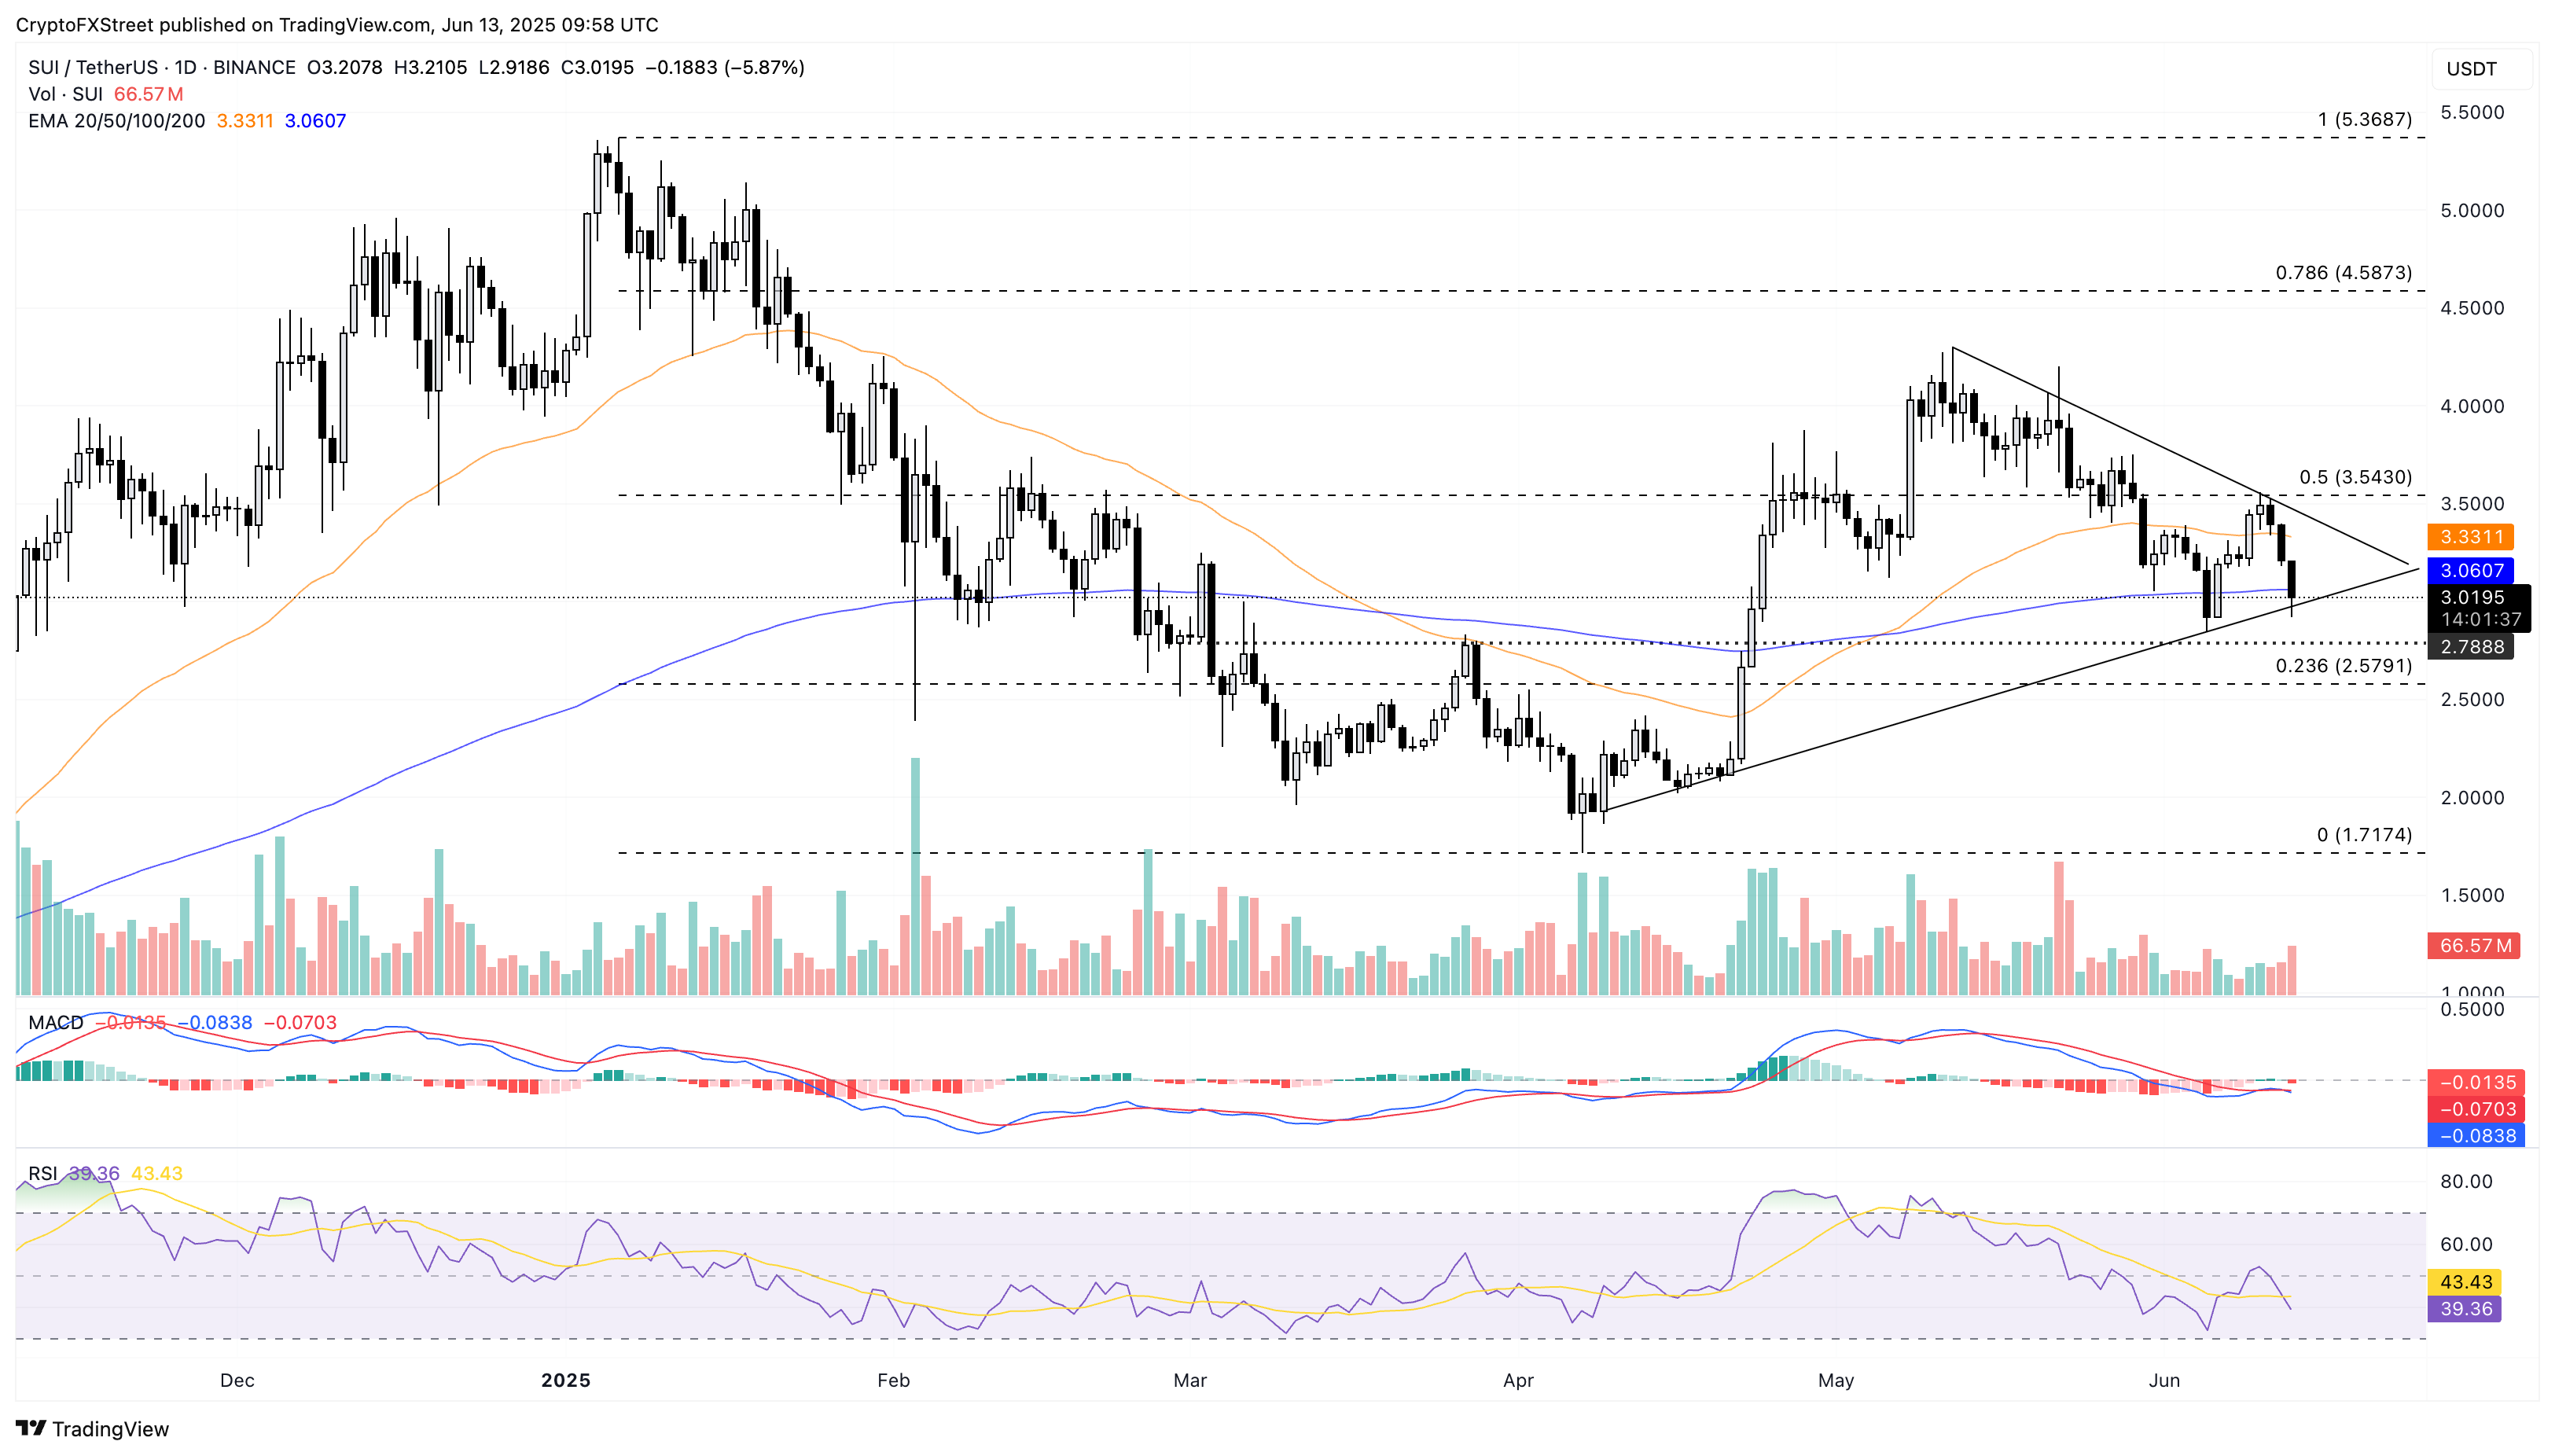
SUI/USDT daily price chart.
Any chances of recovery for Sui largely hinge on prices closing above the 50-day EMA at $3.33. A breakout rally could find immediate resistance at $3.54, aligning with the 50% Fibonacci level.
Author

Vishal Dixit
FXStreet
Vishal Dixit holds a B.Sc. in Chemistry from Wilson College but found his true calling in the world of crypto.


