SUI Price Forecast: Fallout from triangle pattern could lead to further losses toward $2.70
- Sui extends the downfall on Monday after closing in the red for the third consecutive week.
- The technical outlook reveals a triangle pattern holding the fate of Sui.
- Sui unlocked 58.35 million tokens, worth $194 million, on Sunday, signaling an increased supply.

Sui (SUI) is down over 1.50% at press time on Monday after three consecutive weekly closings on a bearish note. As Sui survives the 58.35 million tokens unlocked on Sunday, avoiding a panic sell-off, a potential fallout from a triangle pattern could extend the losses to $2.71.
Sui price holds above $3 within a triangle pattern
Sui trades at $3.30 at the time of writing on Monday, projecting a weak start to the week with an intraday pullback. However, the nearly 5% rise over the weekend helps Sui bounce back from a rising support trendline formed by the lows of April 7 and April 20.
The price action also lights a sloping resistance trendline with lower highs on January 4, May 10, and May 22. With the converging trendline, Sui's daily price chart develops a symmetrical triangle pattern.
Despite the short-term surge on weekends, the altcoin is down by 16% over the last three weeks as it reverses south within the triangle pattern. Holding above the lower trendline, Sui takes an early reversal from the 200-day Exponential Moving Average (EMA) at $3.04 and resurfaces above the 100-day EMA at $3.22.
With bulls holding grounds near the $3 mark, the minor recovery pushes the Moving Average Convergence/Divergence (MACD) line closer to its signal line, hinting at a bullish crossover. A potential crossover will help the indicator lines sustain in the positive territory and stage a revival in bullish momentum.
If the prevailing downfall continues, a clean push in Sui closing below the 100-day EMA at $3.22 could result in the triangle pattern's fallout. In such a case, the 200-day EMA at $3.00 acts as the immediate support, followed by $2.71, the 23.6% Fibonacci retracement level from $5.29 on January 4 to $1.92 on April 7.
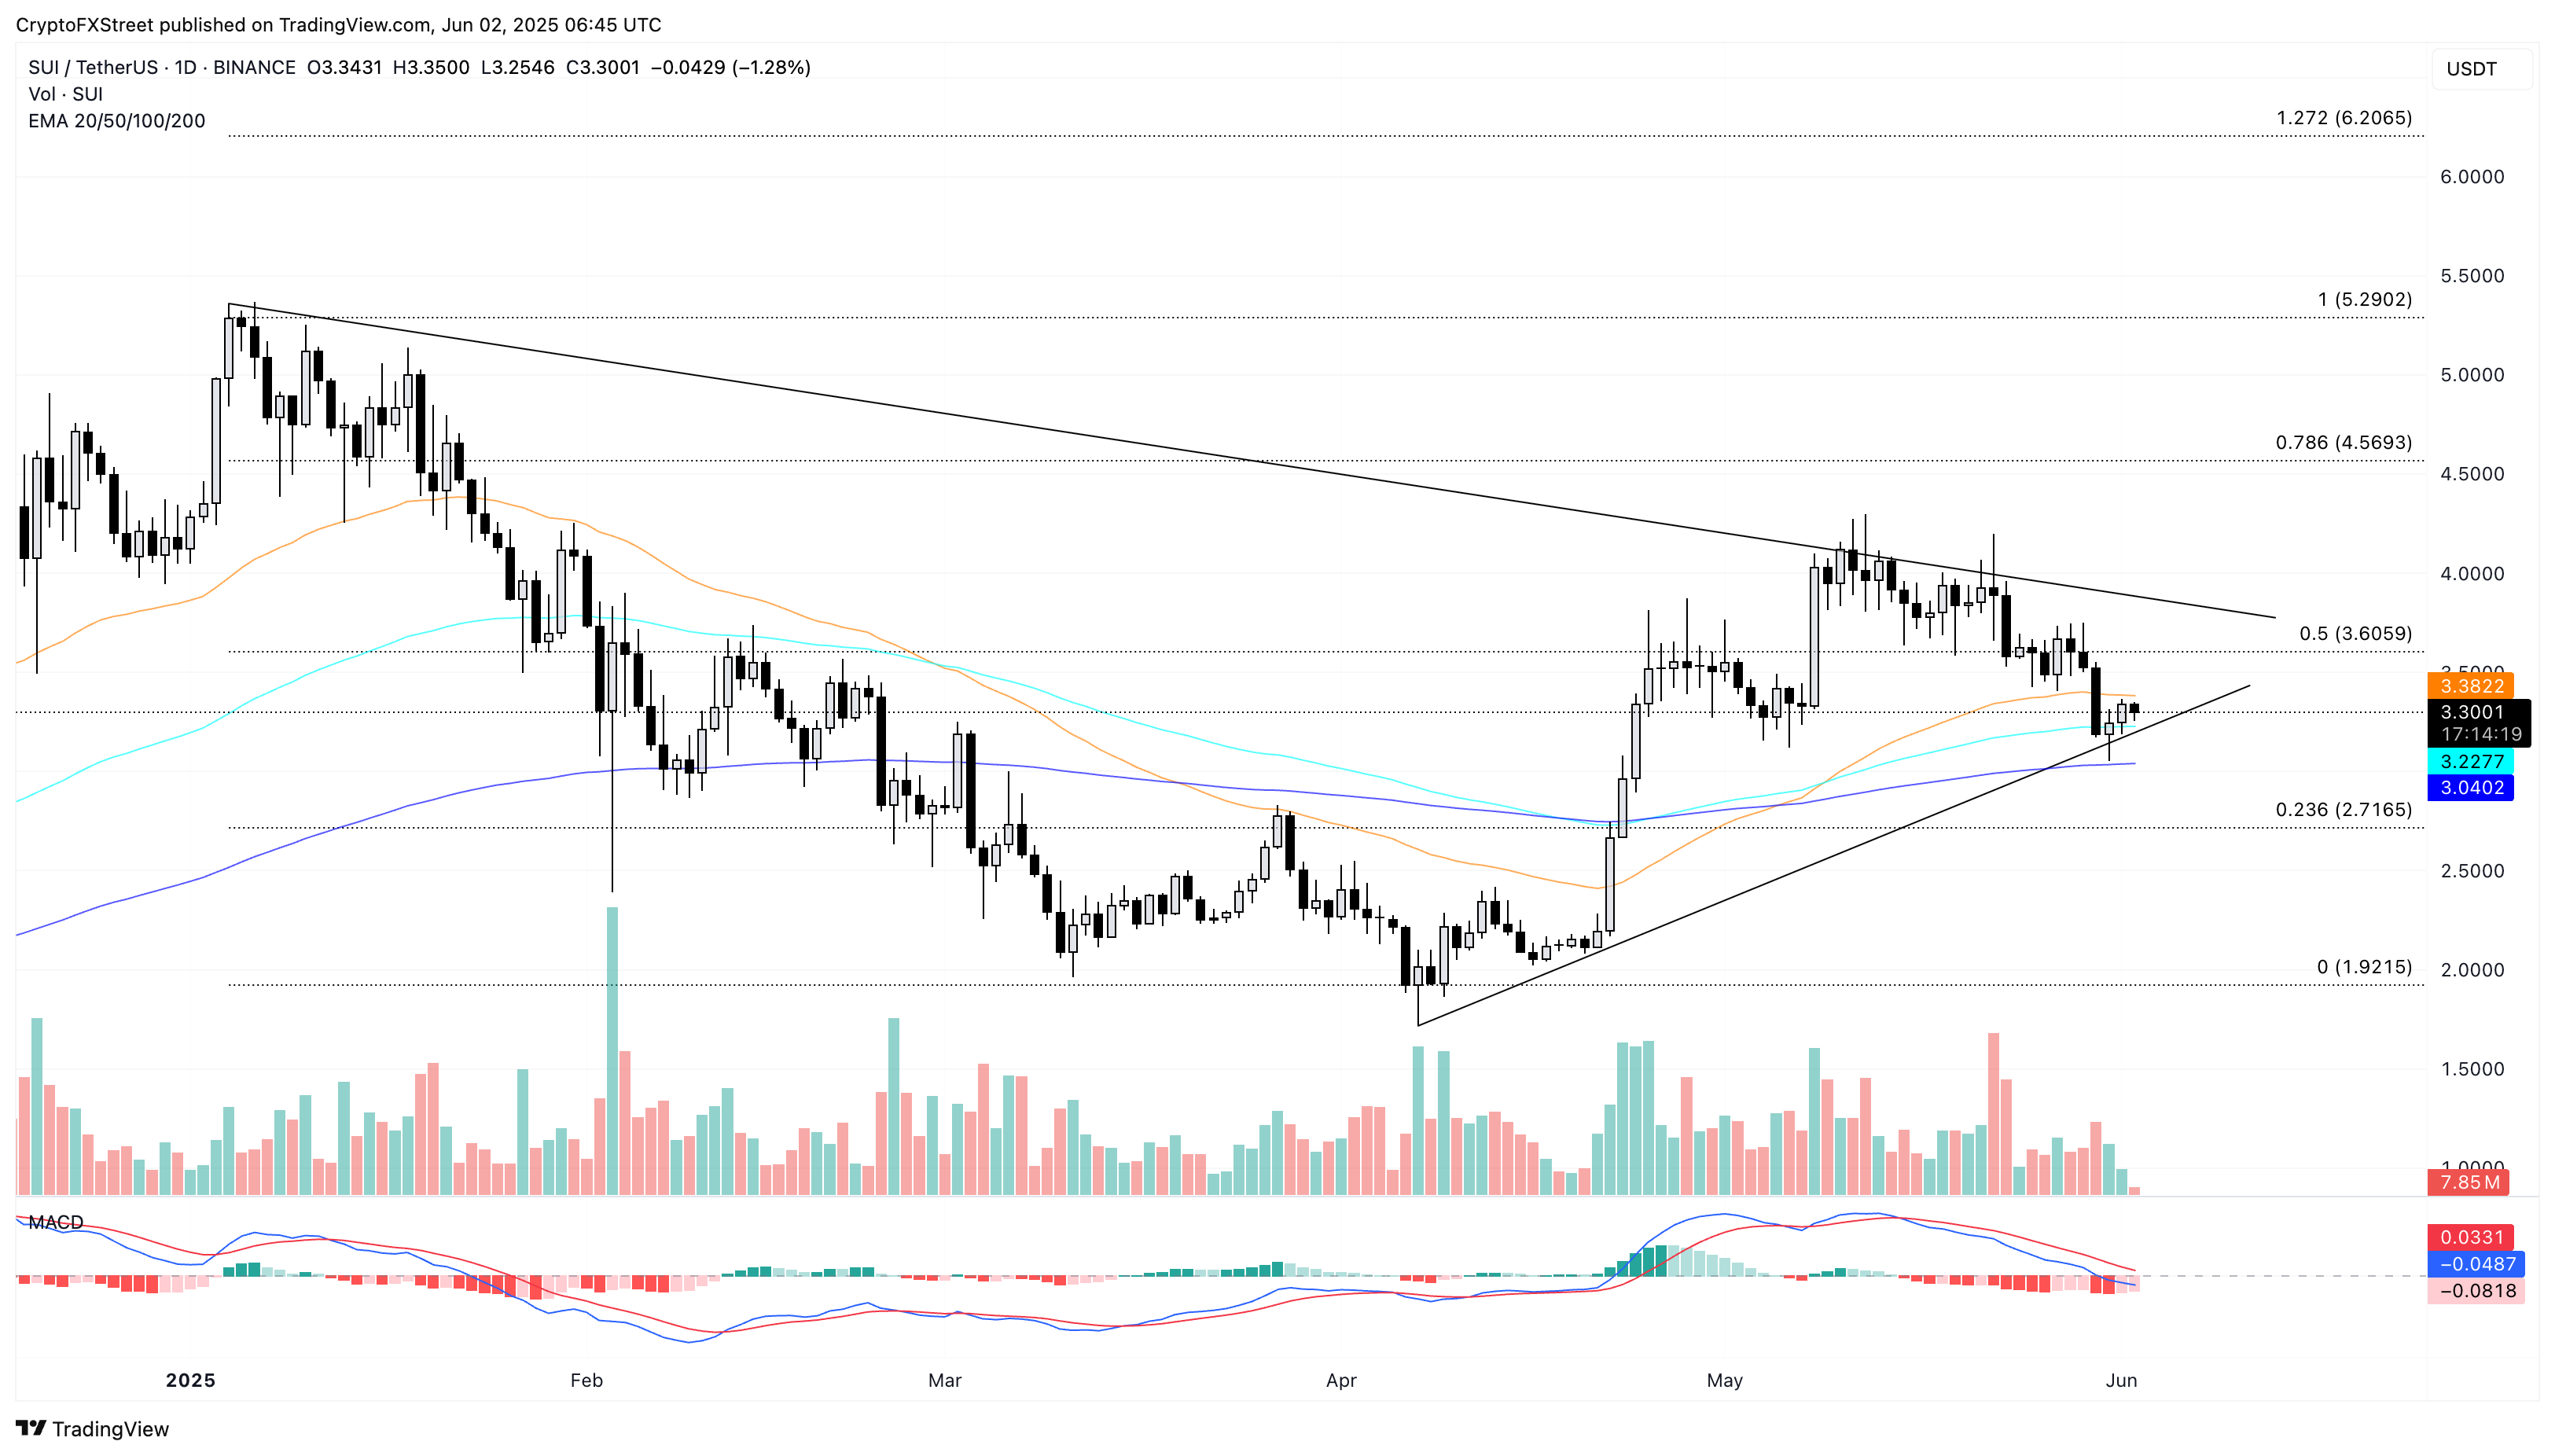
SUI/USDT daily price chart. Source: Tradingview
On the other hand, Sui could face headwinds at the $3.60 resistance, aligning with the 50% Fibonacci retracement level if it continues its bullish cycle within the pattern. A potential cloning above that level could challenge the resistance trendline near $3.80.
Upcoming token unlocks warn of excessive supply
On Sunday, the Sui Foundation unlocked 58.35 million SUI tokens worth $194.09 million, liquidating the market with 0.58% of the maximum SUI supply. The recent unlock is part of a linear unlock process, which has been releasing more SUI supply over the preceding months. On July 1, the upcoming unlock will release another batch of 58.35 million tokens, followed by monthly unlocks of 56.91 million SUI till October 1.
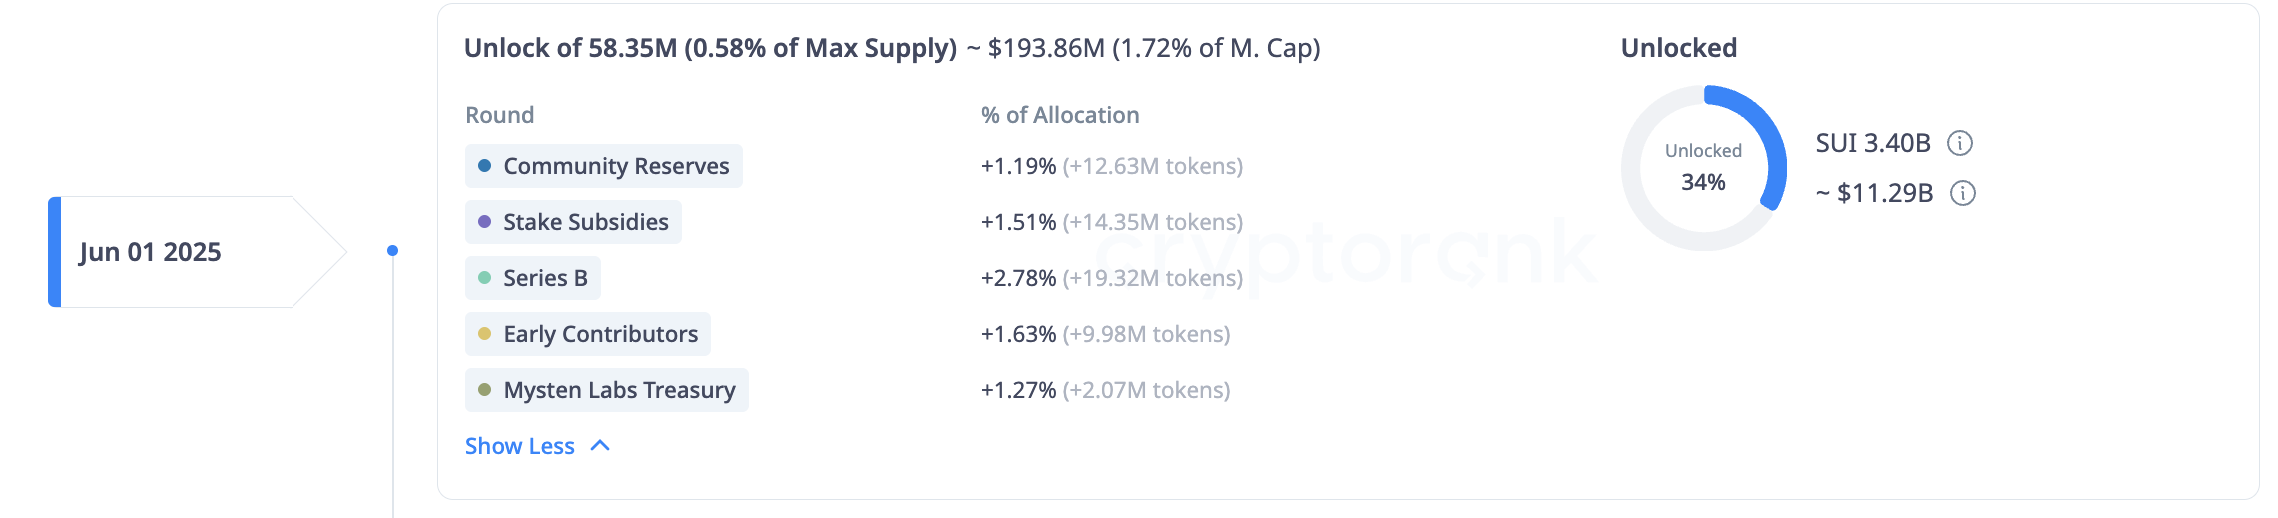
SUI Unlock History. Source: Cryptorank
Currently, Sui holds a circulating supply of 3.396 billion SUI or 33.96% of the maximum 10 billion supply. With the incoming unlocks, Sui could crumble under excessive supply, leading to potentially steeper corrections.
Author

Vishal Dixit
FXStreet
Vishal Dixit holds a B.Sc. in Chemistry from Wilson College but found his true calling in the world of crypto.


