Sui Price Forecast: SUI extends 15% drop as staking balance falls
- Sui declines for the third consecutive day, testing $2.00 on Tuesday.
- A 5% decline in the past 24 hours brings SUI's DeFi TVL to $1.6 billion.
- The Open Interest-weighted funding rate rebounds to 0.0070%, indicating traders are piling into long positions.

Sui (SUI) is trading above $2.00 as bulls try to pare losses at the time of writing on Tuesday. The Layer-1 token has lost 14% of its value since the beginning of this month, mirroring risk-off sentiment and fear in the broader cryptocurrency market.
SUI could drop another 15% if sellers continue to overwhelm buyers in the short term, especially given that the derivatives market remains weak after the October 10 sell-off.
Sui's staking balance drops as holders exit
Investors are increasingly reducing exposure to riskier assets, including Sui. According to the token's Total Value Locked (TVL) in the Decentralized Finance (DeFi) ecosystem, staking balance has declined by 4.76% to $1.6 billion over the past 24 hours.
The drop in TVL coincides with SUI's persistent downtrend, affirming the bearish sentiment surrounding the token. Investors tend to withdraw their holdings from smart contract protocols when they lose confidence in the token and the ecosystem's ability to sustain growth. Meanwhile, selling pressure in the open market builds, making recovery a pipe dream.
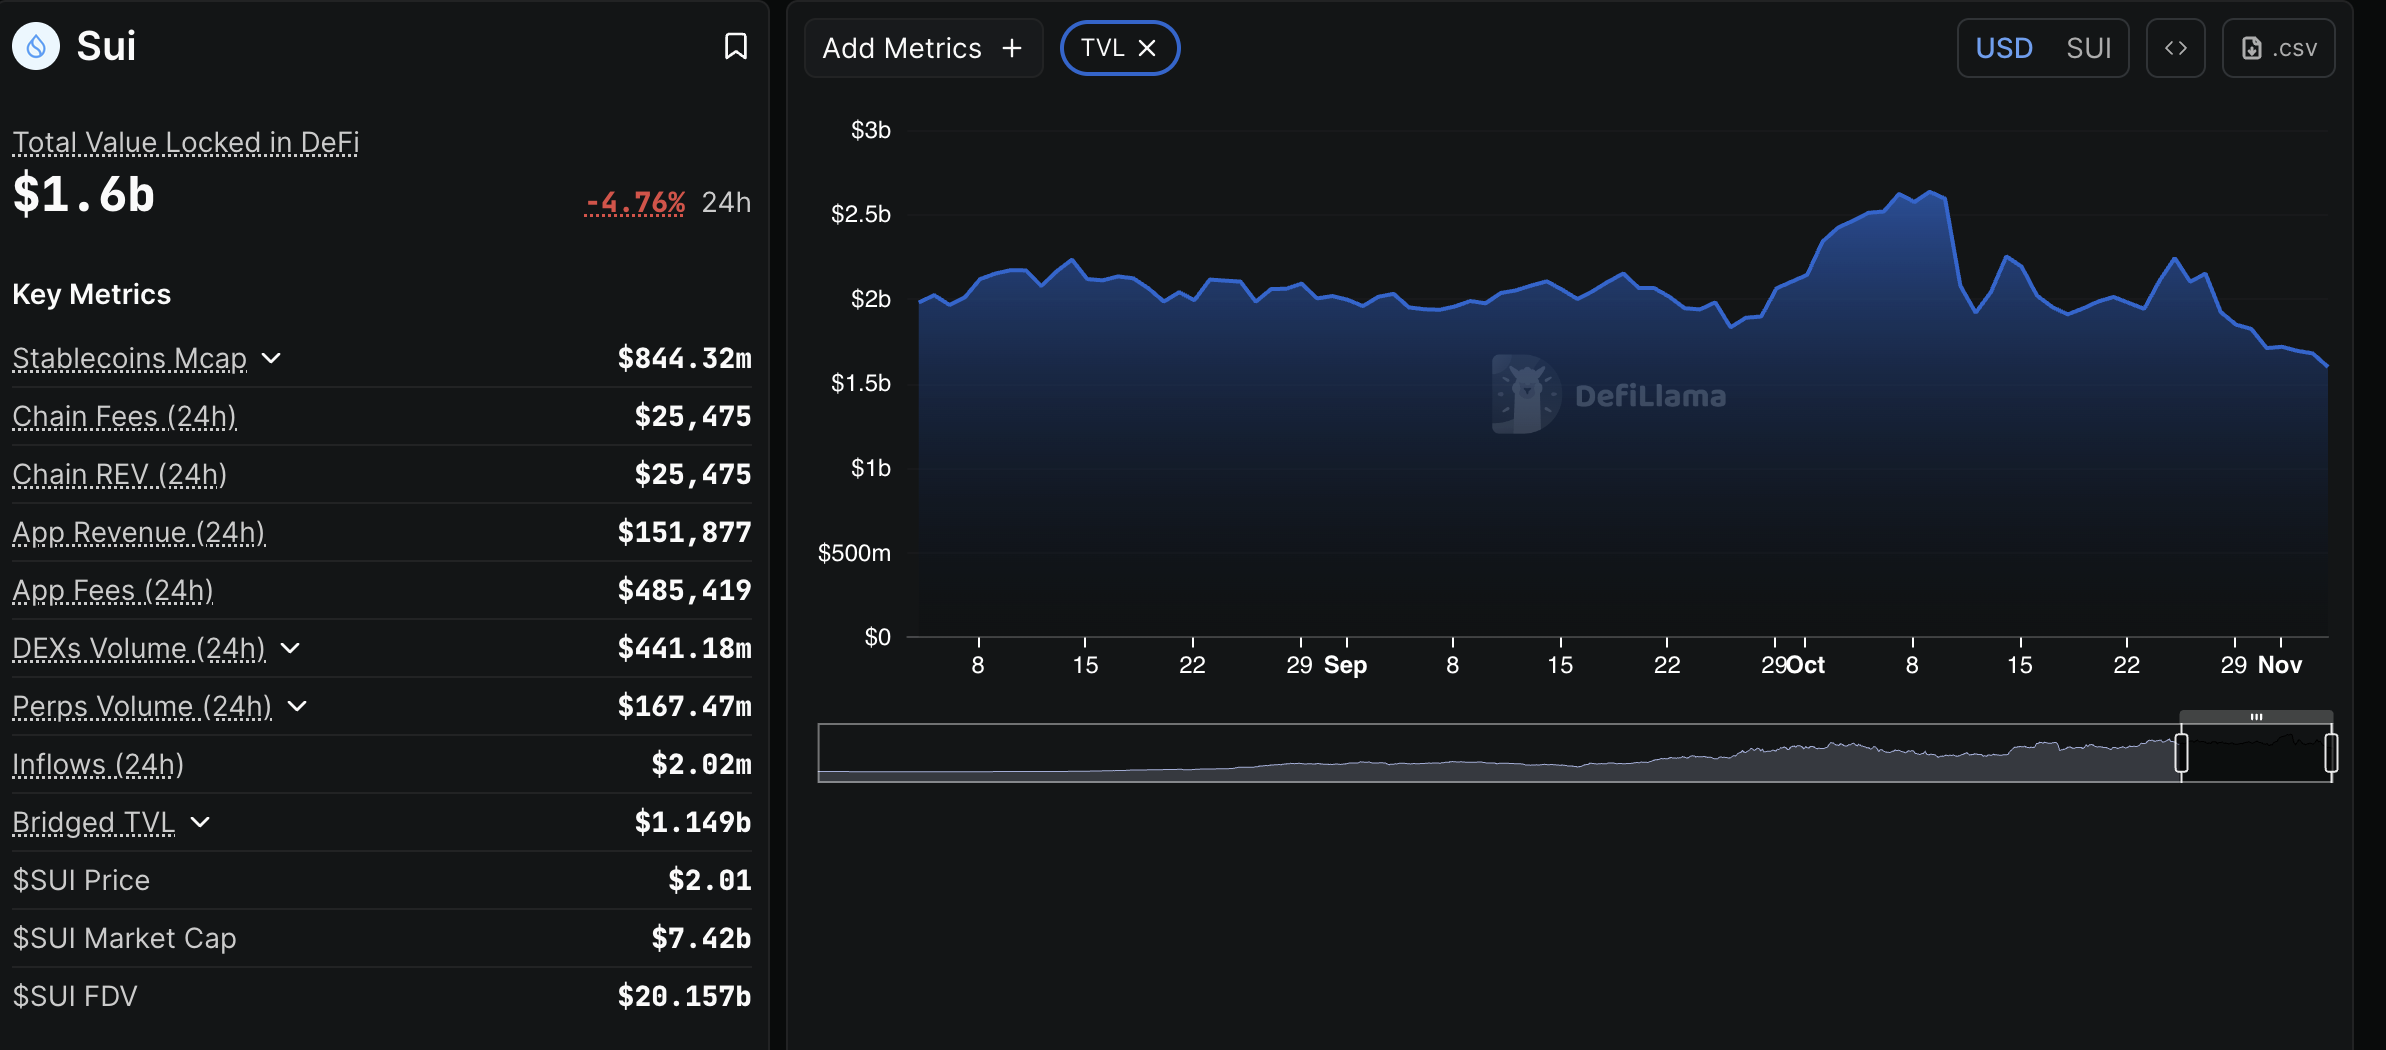
Sui DeFi TVL Source: DefiLlama
Still, investors appear to be seeking exposure via long positions in the derivatives market, as evidenced by the Open Interest-weighted funding rate rising to 0.0070% from 0.0002% on Monday. A steady increase in this metric suggests that traders see new opportunities emerging as SUI's price hovers above its $2.00 support.
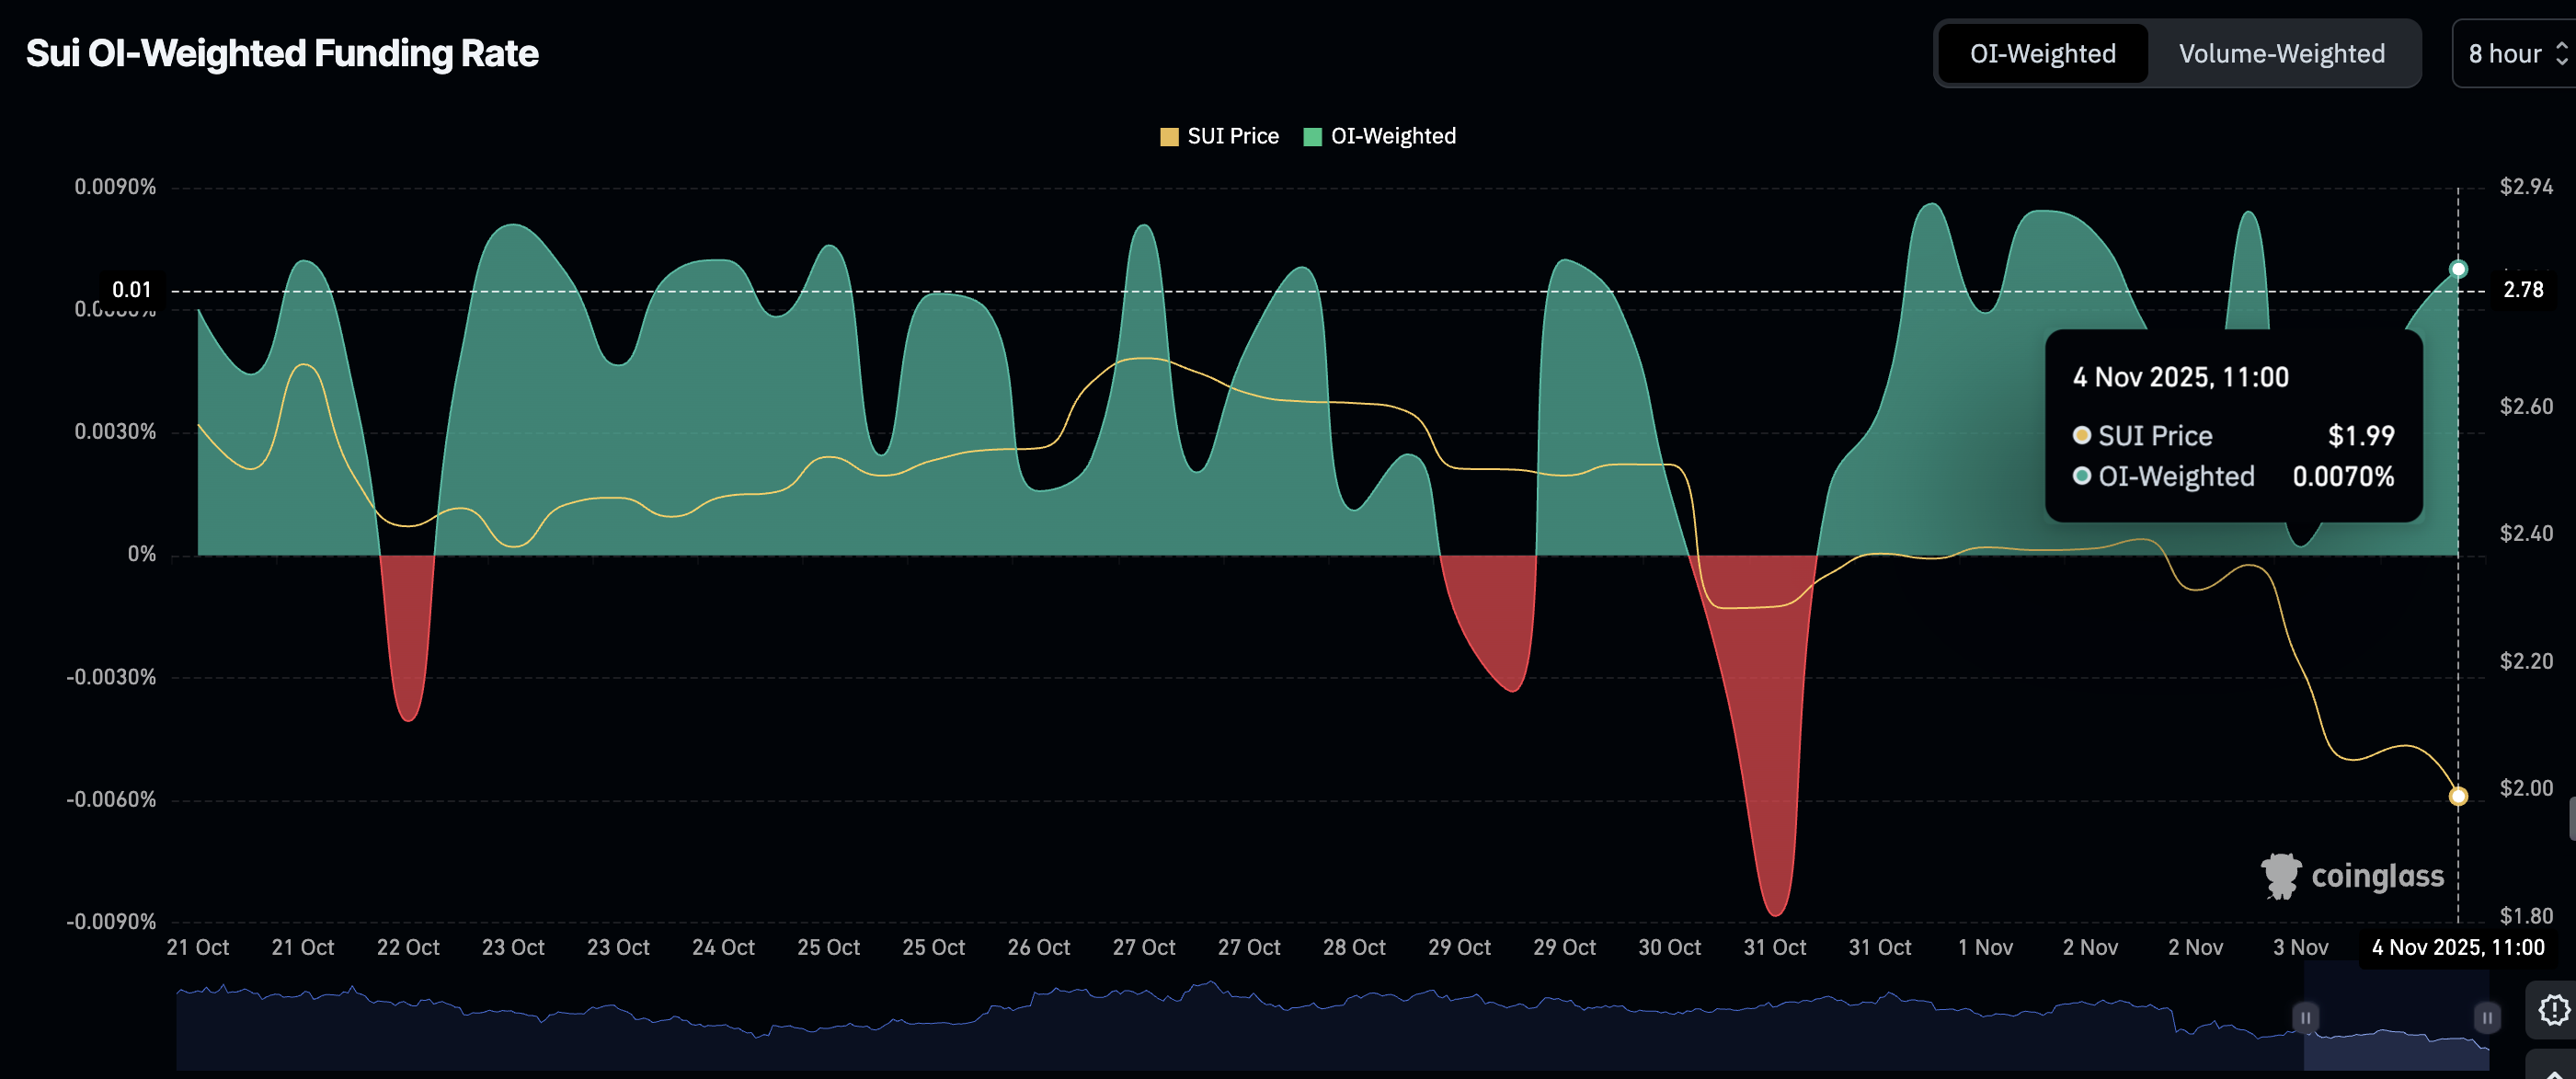
Sui OI-Weighted Funding Rate | Source: CoinGlass
Technical outlook: Assessing Sui's bearish outlook
Sui's technical structure signals more pain in the coming days if support at $2.00 breaks. The Moving Average Convergence Divergence (MACD) indicator confirmed a sell signal on Monday, encouraging traders to reduce exposure, which likely contributed to selling pressure.
The Relative Strength Index (RSI), stable at 29 on the daily chart, hints at consolidation. This period of stability could allow traders to position themselves ahead of the next recovery attempt.
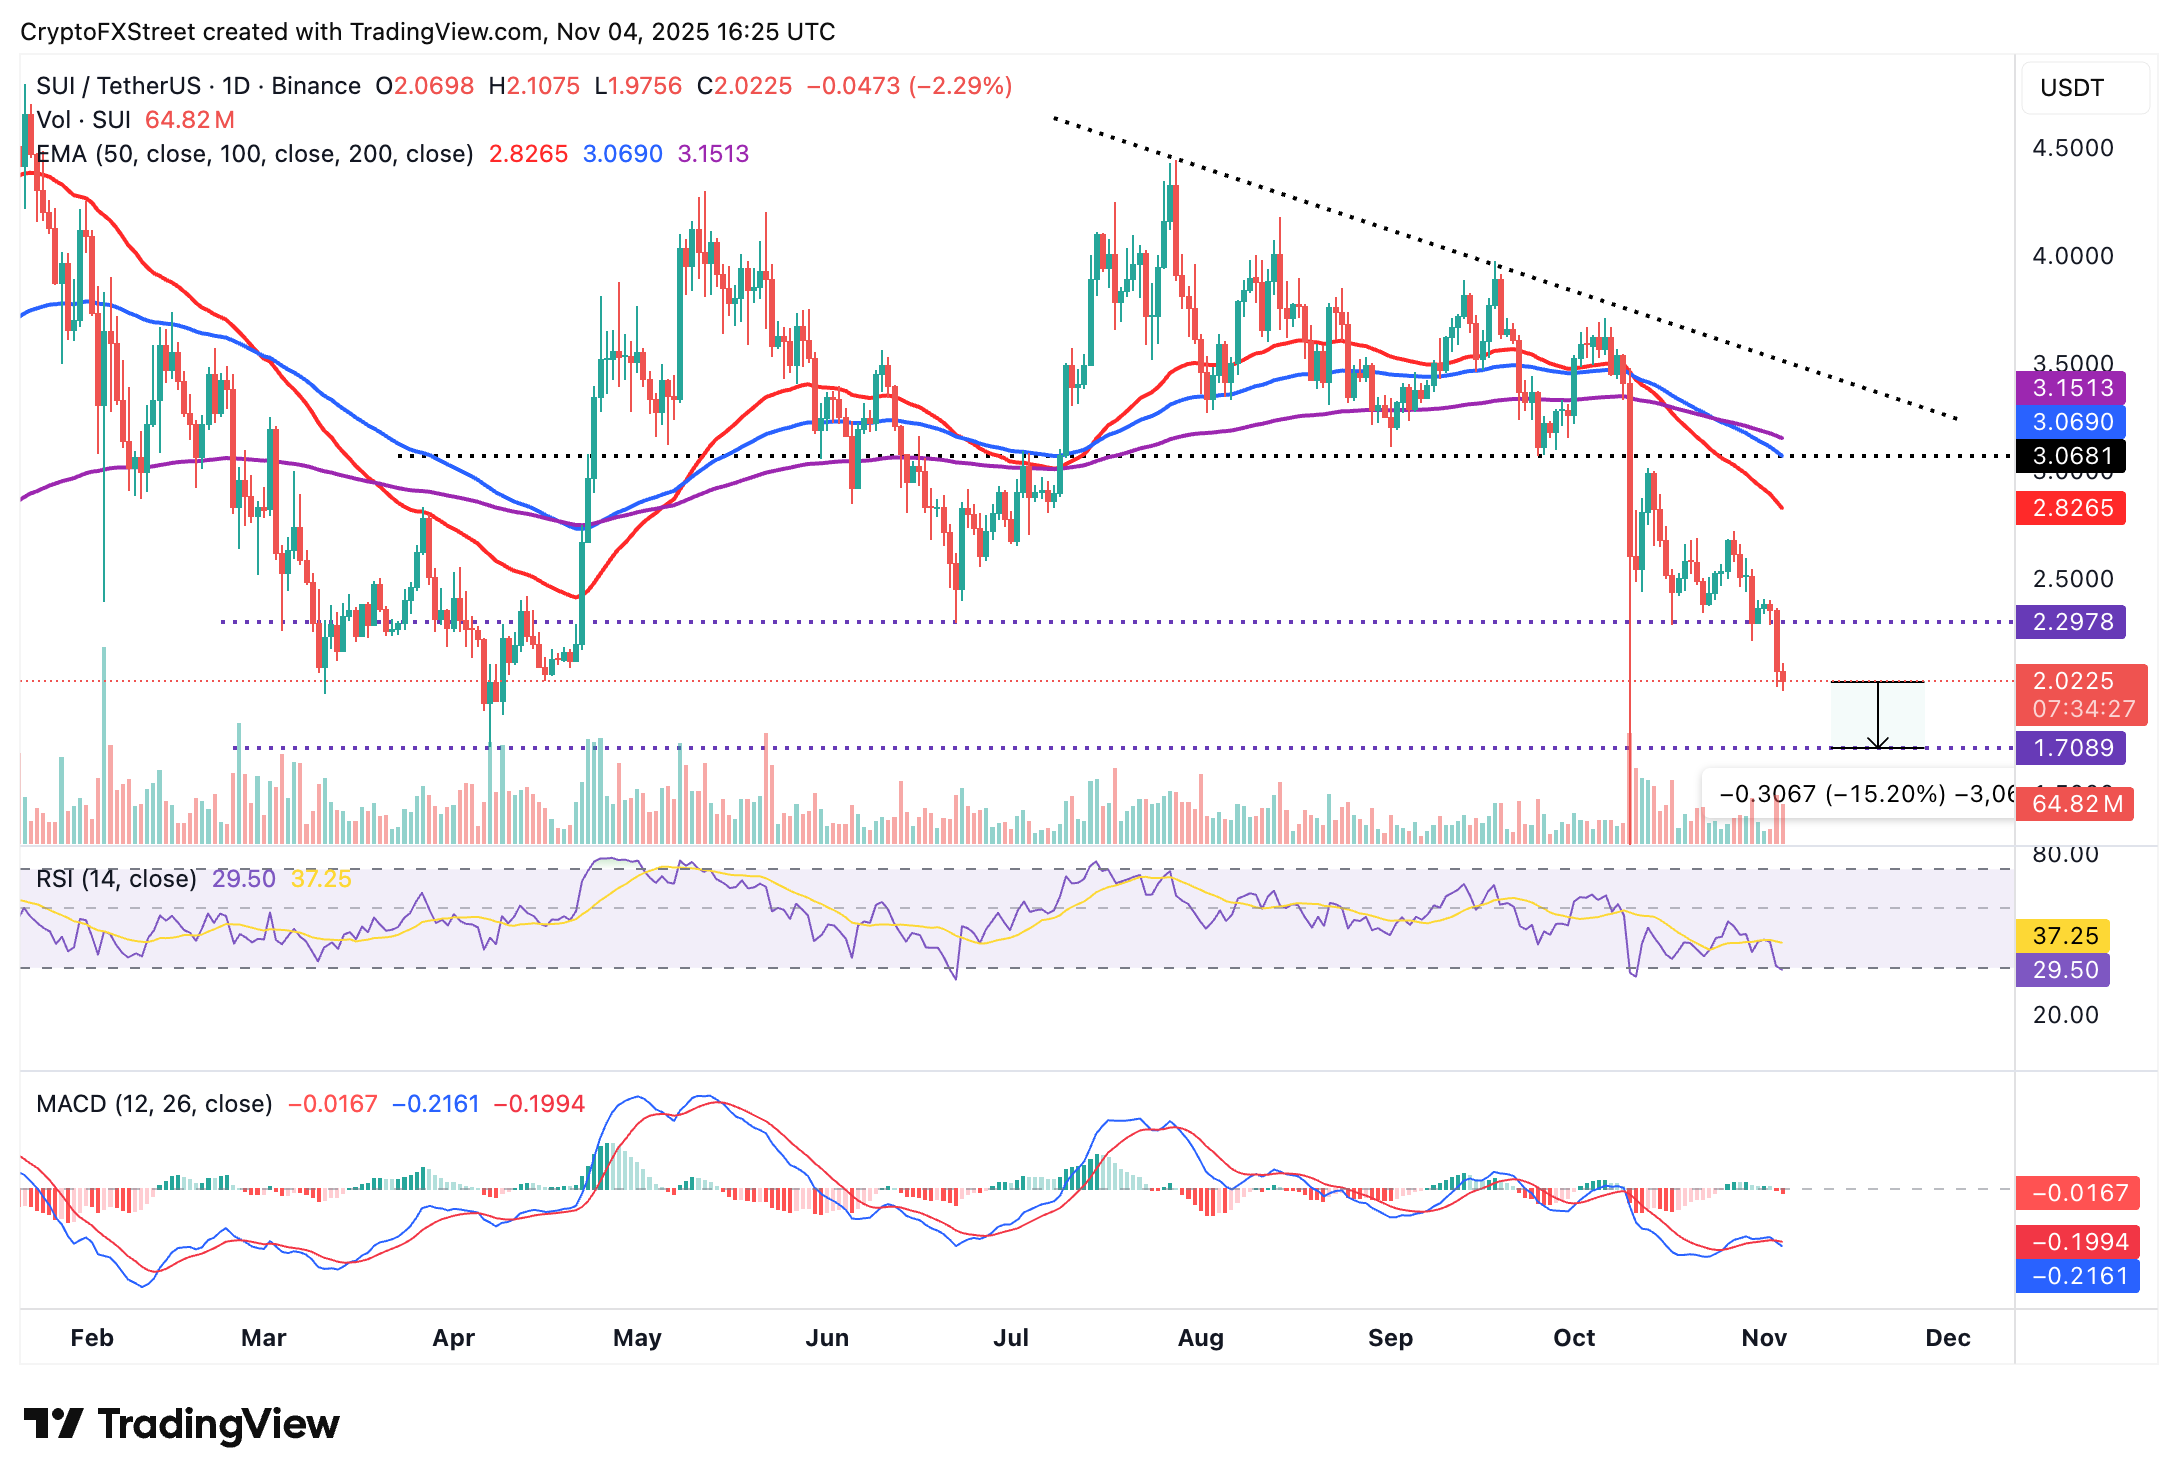
SUI/USDT daily chart
Still, Sui's position below key moving averages, including the 50-day Exponential Moving Average (EMA) at $2.82, the 100-day EMA at $3.06 and the 200-day EMA at $3.15, highlights a sticky bearish situation that may keep the price suppressed near the short-term $2.00, or lead to a 17% decline to $1.70, last tested in April.
Open Interest, funding rate FAQs
Higher Open Interest is associated with higher liquidity and new capital inflow to the market. This is considered the equivalent of increase in efficiency and the ongoing trend continues. When Open Interest decreases, it is considered a sign of liquidation in the market, investors are leaving and the overall demand for an asset is on a decline, fueling a bearish sentiment among investors.
Funding fees bridge the difference between spot prices and prices of futures contracts of an asset by increasing liquidation risks faced by traders. A consistently high and positive funding rate implies there is a bullish sentiment among market participants and there is an expectation of a price hike. A consistently negative funding rate for an asset implies a bearish sentiment, indicating that traders expect the cryptocurrency’s price to fall and a bearish trend reversal is likely to occur.
Author

John Isige
FXStreet
John Isige is a seasoned cryptocurrency journalist and markets analyst committed to delivering high-quality, actionable insights tailored to traders, investors, and crypto enthusiasts. He enjoys deep dives into emerging Web3 tren



