|

Stellar Price Prediction: XLM to drop by 25% if key support level fails to hold

  • Stellar price is trying to hold a critical support level to avoid falling further.
  • It seems that XLM might be on the verge of a massive price move according to an indicator.

XLM has been trading sideways for the past three days and it’s currently trying to defend a critical support level on the 4-hour chart to avoid a stronger pullback. However, not everything looks dull for the bulls which might come out on top in the end if a bull flag developing on the same time frame gets confirmed.

Stellar price on the cusp of a significant price move

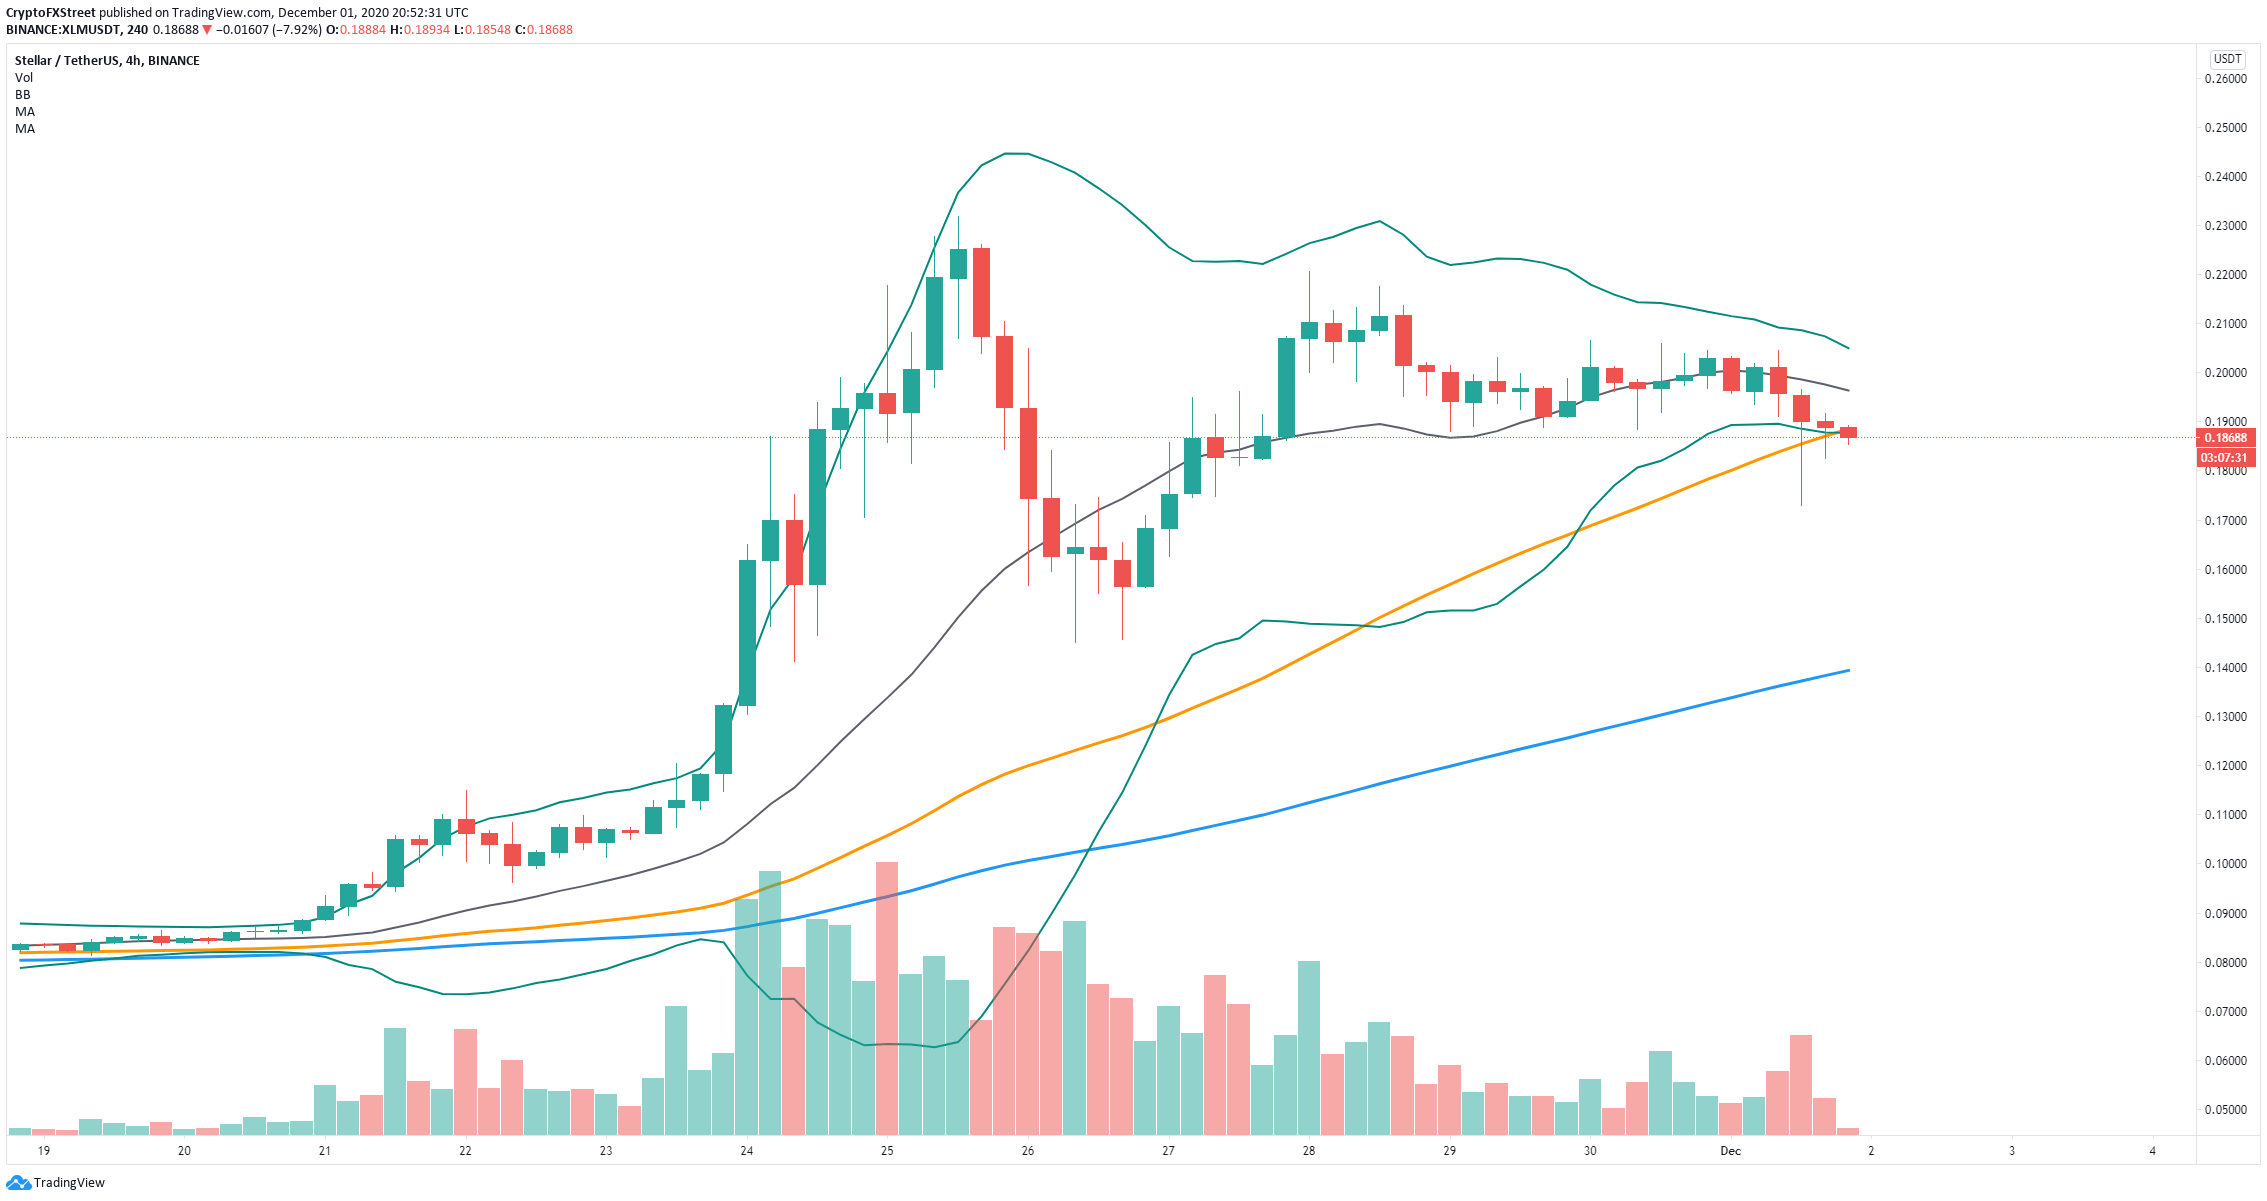
On the 4-hour chart, Stellar price is trading right at the 50-SMA trying to defend this critical support level which hasn’t been lost since November 15. Additionally, it seems that the Bollinger Bands have squeezed significantly in the past several hours, indicating that a major price move is underway.
xlm price

XLM/USD 4-hour chart

A breakdown below the 50-SMA at $0.187 and the lower Bollinger Band would be significant and likely to push Stellar price towards the low of November 26 at $0.145 and potentially lower at $0.139 where the 100-SMA currently stands. 
xlm price

XLM/USD 4-hour chart

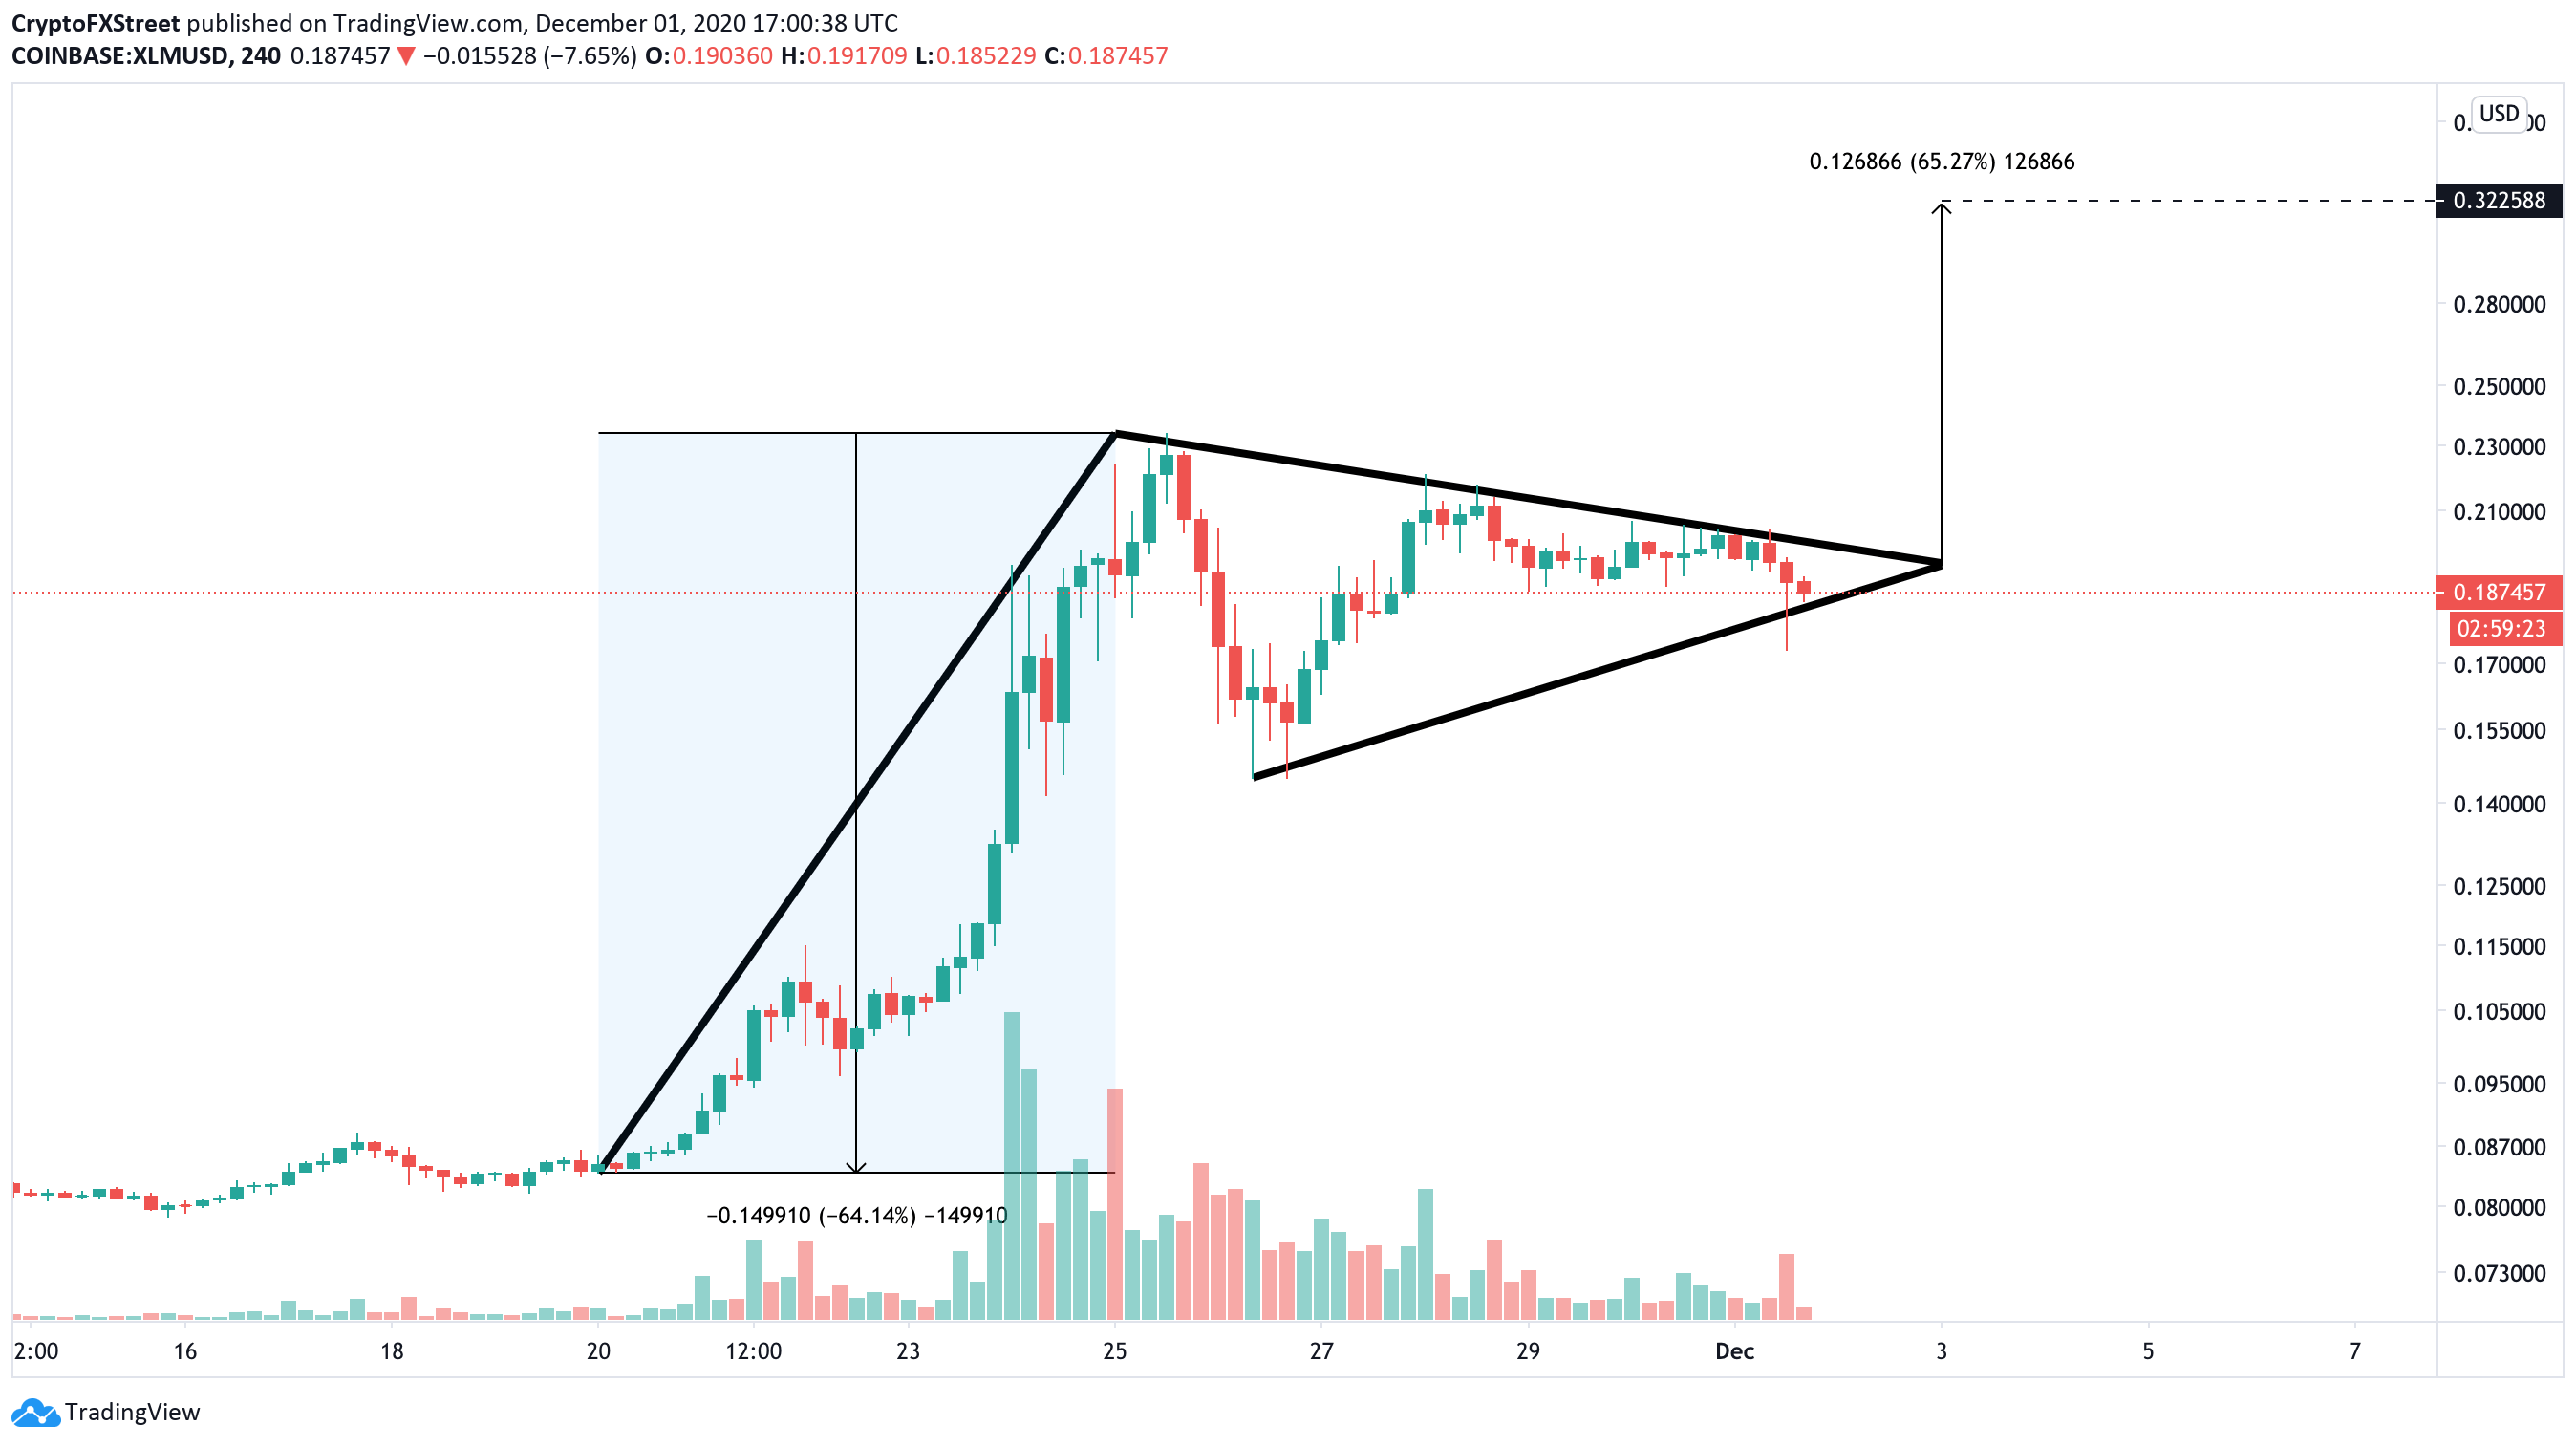
On the other hand, in the same time-frame, it seems that a potential bull flag has formed and it’s close to a breakout. Using the height of the pole we can determine the most likely bullish price target which seems to be $0.322. XLM needs to hold the 50-SMA and break above the triangle for that to happen.

Author

Lorenzo Stroe

Lorenzo Stroe

Independent Analyst

Lorenzo is an experienced Technical Analyst and Content Writer who has been working in the cryptocurrency industry since 2012. He also has a passion for trading.


More from Lorenzo Stroe
Share:

Editor's Picks

Ripple and Stellar outlook: XRP rally cools, XLM heads toward a make-or-break support

Ripple and Stellar trade under pressure after losing over 2% and 3% so far this week. XRP and XLM are both nearing their crucial support zones, which could determine the next directional move. Meanwhile, mixed derivatives and on-chain data suggest upside potential remains limited for both altcoins. CryptoQuant’s summary data shows cautious signs for both altcoins.

Crypto Overview: Bitcoin dips below $78,000 – NEAR, ZEC sustain gains

Bitcoin trades below $78,000 maintaining a near-term corrective tone amid hawkish macroeconomic factors. US bond market shrugs off the US Treasury's increase in buyback operations to $6 billion in long-term debt as yields continue to rise, signaling an insufficient step amid the ongoing war with Iran.

Bitcoin outperforms global assets as $83K-$86K resistance zone continues to weigh on rally

Bitcoin has continued to recover from its mid-year weakness, outperforming major traditional assets over the past month, amid strong resistance around the $83,000 to $86,000 range. BTC gained 23% over the past 21 trading sessions, while the S&P 500 and Nasdaq 100 were broadly flat and the Euro Stoxx 50 declined, according to a Glassnode report published Wednesday.

Ethereum Price Forecast: ETH holds near $2,500 amid derivatives weakness
Ethereum (ETH) holds steady near $2,500 on Wednesday amid weakness in derivatives and mild buying dominance in spot markets. Since the short squeeze that expanded ETH's rally toward $2,500 in late August, meaningful leverage has yet to return to support the uptrend.
Bitcoin: Gearing up for a sharp move
Bitcoin (BTC) is trading around $81,000 on Friday, up over 4% so far this week, and awaits a key catalyst that could determine its next directional move. Strong institutional demand is supporting the bullish price action, with spot BTC Exchange Traded Funds (ETFs) on track to record a third straight week of inflows.

