Stellar Price Forecast: XLM downward momentum weakening, as bulls prepare to regain control
- Stellar is likely to extend the bearish outlook to $0.14 before recovery comes into the picture.
- A buy signal on the daily chart indicates bullish potential and closing above $0.15 would be a massive positive signal.

Stellar bulls are nursing wounds after a massive battering from the sellers over the last 24 hours. The cross-border token has extended the bearish leg under $0.15 and is currently trading at $0.146. Sellers appear to be engulfed by exhaustion amid improving technicals.
Stellar downtrend on its last stroke
XLM/USD breakdown begun after the remarkable uptrend in November hit a barrier at $0.23. Initial support above $0.14 saw Stellar recover considerably and touch $0.22. Since then, the price has been on a consistent downtrend with the token’s upside capped under a descending trendline.
The bearish outlook seems to have been confirmed following the drop under the 50 Simple Moving Average and the 100 SMA support levels. According to the Relative Strength Index, Stellar is likely to refresh November support before a significant recovery occurs.
Closing the day above $0.15 would be a bullish signal. New upward momentum will come into the picture if Stellar steps above the descending trendline resistance.
%20(13)-637430988502276664.png)
XLM/USD 4-hour chart
The TD Sequential indicator has flashed a buy signal on the daily chart in the form of a red nine candlestick. If validated, the demand for XLM will surge, creating enough volume to support recovery in one to four daily candlesticks. Price action above the key resistance at $0.18 might call for more buy orders; perhaps the tailwind will be strong enough for gains above $0.2.
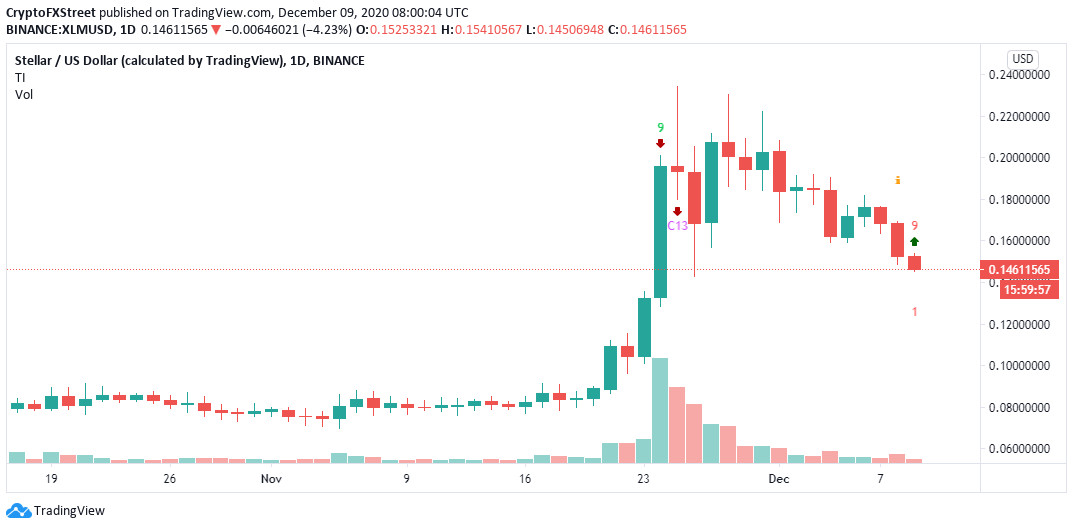
XLM/USD daily chart
It is worth noting that Stellar’s short-term analysis is bearish, and if support at $0.14 fails to hold, declines might overshoot to test the 200 SMA at $0.13. Further down, the next key buyer congestion zones include $0.1 and $0.08.
Author

John Isige
FXStreet
John Isige is a seasoned cryptocurrency journalist and markets analyst committed to delivering high-quality, actionable insights tailored to traders, investors, and crypto enthusiasts. He enjoys deep dives into emerging Web3 tren


