Solona price eyes 22% breakout as SOL directional bias vanishes
- Solana price is forming an ascending parallel channel, suggesting an ongoing uptrend.
- A breakdown from this channel could lead to a 17% descent to $124.83.
- However, a decisive close above $175 could trigger an 11% ascent to $195.43.

Solana price is showing an affinity to move higher, but its price action is resulting in the development of a bearish structure in the short term. Therefore, SOL shows no apparent directional bias and could head either way. However, investors can look to two crucial barriers to try and predict its breakout.
Solana price looks lost
Solana price rose 54% from September 21 to October 3 and set up a local top. This ascent took place in steps, where SOL formed higher highs and higher lows. So far, there are two distinctive swing highs and lows, which when connected using trend lines reveal the formation of an ascending parallel channel.
Although this technical formation is not complete, it has a bearish bias. Rivaling this pessimistic outlook is the higher high formed on October 3, which breached the September 18 swing point at $171.14. Therefore, Solana price needs to bounce off the $151 support floor and breach the immediate barrier at $175 to kick-start an upswing.
Assuming it does, investors can expect SOL to continue its journey, tagging $195.43. This climb would constitute a 22% ascent from the current position.
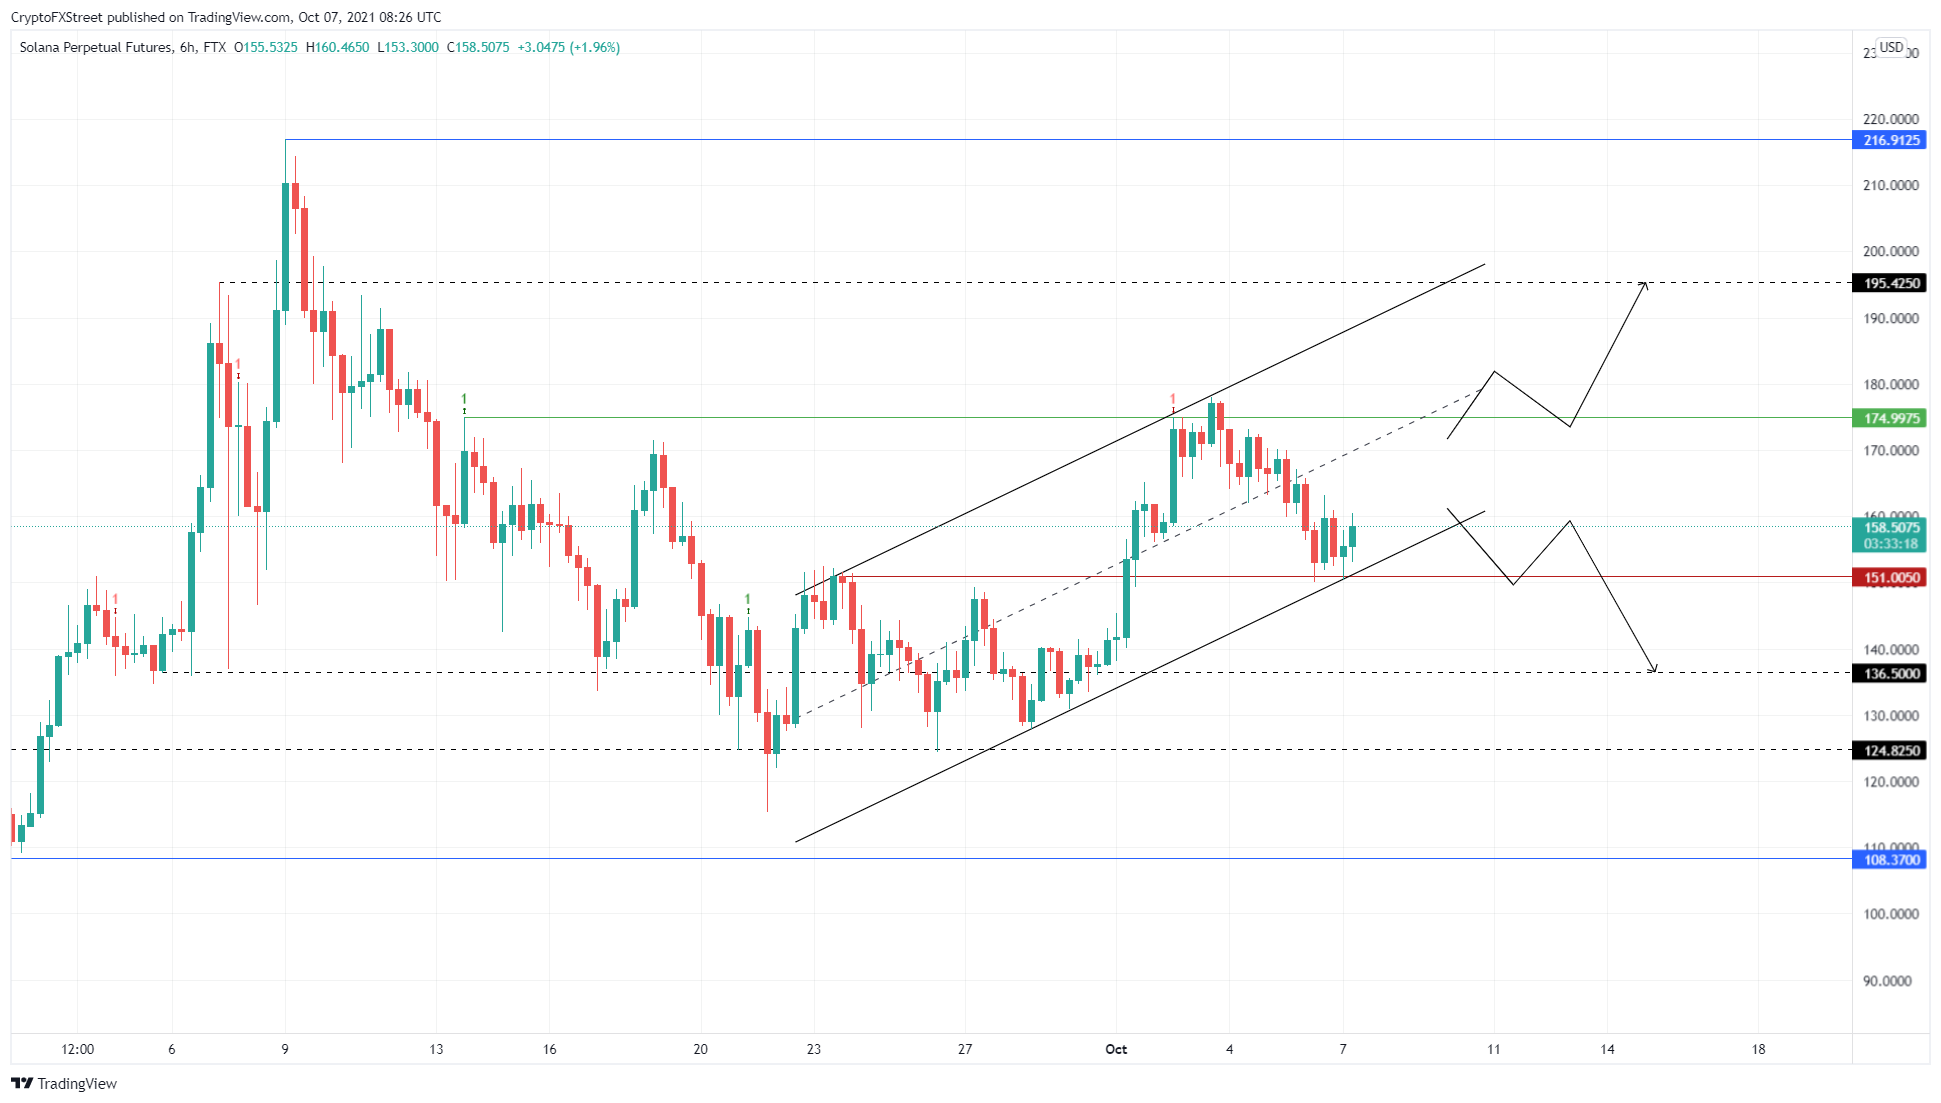
SOL/USDT 6-hour chart
However, if Solana price fails to bounce off $151 but instead breaches it, it will denote weak buying pressure and knock SOL down by 9.7% to $136.50 and, in some cases, $124.83.
This downswing would represent a 22% descent from the current position.
Market participants need to know that Solana price does not have a strong directional bias yet. Therefore, the $175 and $151 levels can help identify where SOL could head next.
Author

Akash Girimath
FXStreet
Akash Girimath is a Mechanical Engineer interested in the chaos of the financial markets. Trying to make sense of this convoluted yet fascinating space, he switched his engineering job to become a crypto reporter and analyst.