Solana Price Prediction: SOL needs to clear one hurdle to retest all-time high
- Solana price broke out of a symmetrical triangle on October 1 and rallied 23%,
- However, SOL is struggling with momentum as it hovers above the $170.72 support floor.
- A decisive close above $18.21 will open a resistance-free path to retest the all-time high at $216.91.

Solana price slid into consolidation from September 21 to September 31, forming a symmetrical triangle pattern. A spike in bullish momentum led to a breakout, pushing SOL by 23%. However, the altcoin can go higher, but it needs to clear a crucial resistance barrier.
Solana price needs to rally against odds
Solana price set up two lower highs and three higher lows since September 21. Connecting these swing points using trend lines shows the formation of a symmetrical triangle pattern. This technical formation forecasts a 24% breakout, determined by measuring the distance between the first swing high and swing low.
On October 1, Solana price sliced through the upper trend line at $143.95, leading to a breakout. Since then, SOL has rallied through the $150.34 and $170.73 resistance barriers. However, it did not hit the intended target at $79.43.
AS Solana price currently consolidates above this support floor, the Momentum Reversal Indicator (MRI) flashed a red ’one’ sell signal on the six-hour chart.
This technical formation forecasts a one-to-four candlestick correction. While Solana price has already created one red six-hour candlestick, it is unsure if the downswing is over.
If SOL manages to produce a decisive close above $188.20, it will open a resistance-free path for Solana price to retest the all-time high at $216.91.
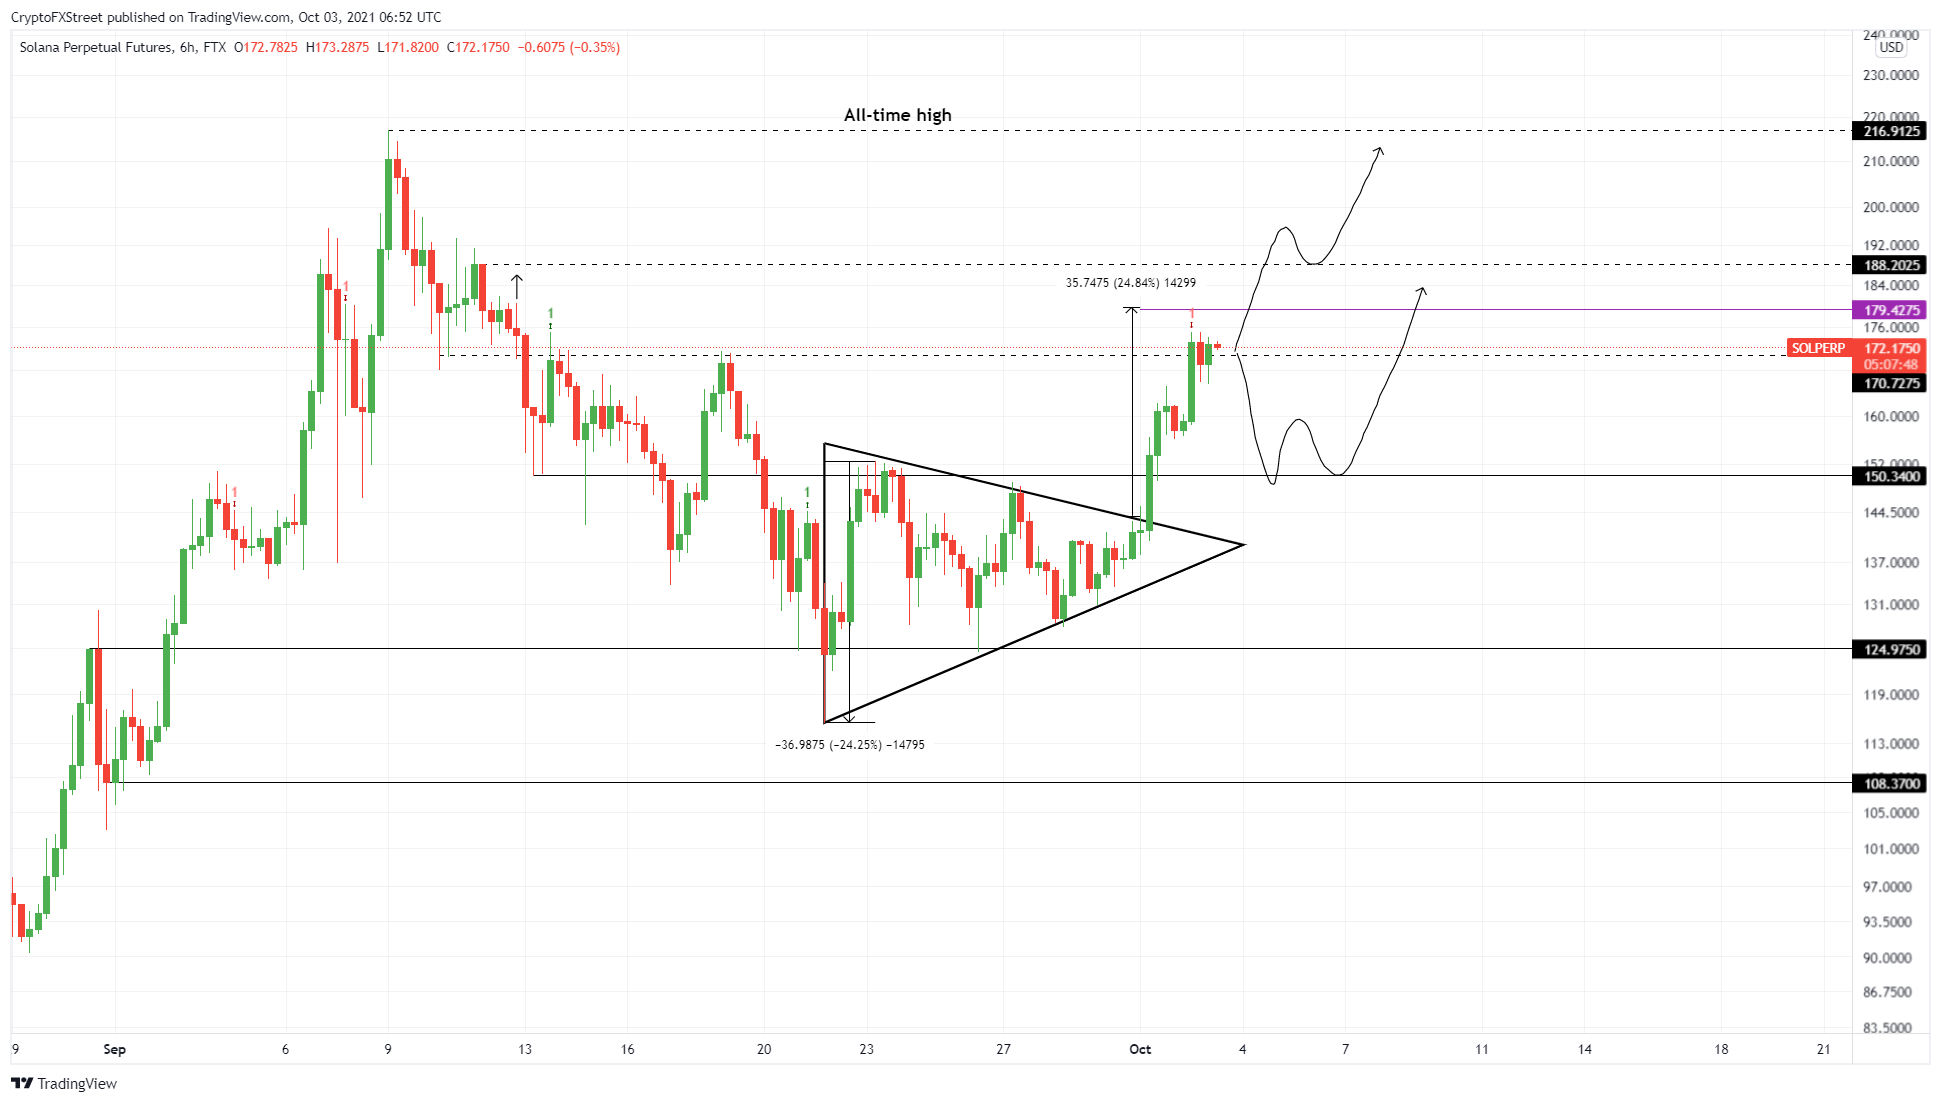
SOL/USDT 6-hour chart
While things are on the fence for Solana price, a breakdown below $170.73 will confirm that the investors are booking profits.
In such a case, SOL price will likely retrace to $150 before giving the uptrend another go. However, a breach below this support floor will invalidate the bullish thesis.
Author

Akash Girimath
FXStreet
Akash Girimath is a Mechanical Engineer interested in the chaos of the financial markets. Trying to make sense of this convoluted yet fascinating space, he switched his engineering job to become a crypto reporter and analyst.



