- Solana price looks optimistic despite the recent correction.
- SOL choppy session continues as a triangle pattern remains intact.
- Only by overcoming the $234 level can prices rise towards $260.
Solana price has been consolidating in a narrow range, forming a bullish continuation pattern on its 4-hour chart. A spike in demand could push SOL higher as it has already completed its correction.
Solana price attempts to rebound strongly
Solana price looks bullish in the long term. Still, there's been a slight downward correction in its price lately. SOL’s short-term technical outlook remains neutral as it's held in a choppy trading range between $234 and $210.
The fifth-largest cryptocurrency by market cap has formed a symmetrical triangle on the 4-hour chart. This type of technical pattern tends to break out in either direction, but for Solana other indicators support the bullish outlook.
For instance, the 50-day exponential moving average is acting as stable support at $200, and closing candles above this EMA is indicative of an uptrend. The upward trendline from Oct. 12 to Nov. 18 is still intact, serving as an additional layer of support. Meanwhile, the RSI crossed above 50, which is another positive sign.
A spike in buying pressure around the current price levels could validate the bullish thesis and create additional room for an upswing to $234 or $262.
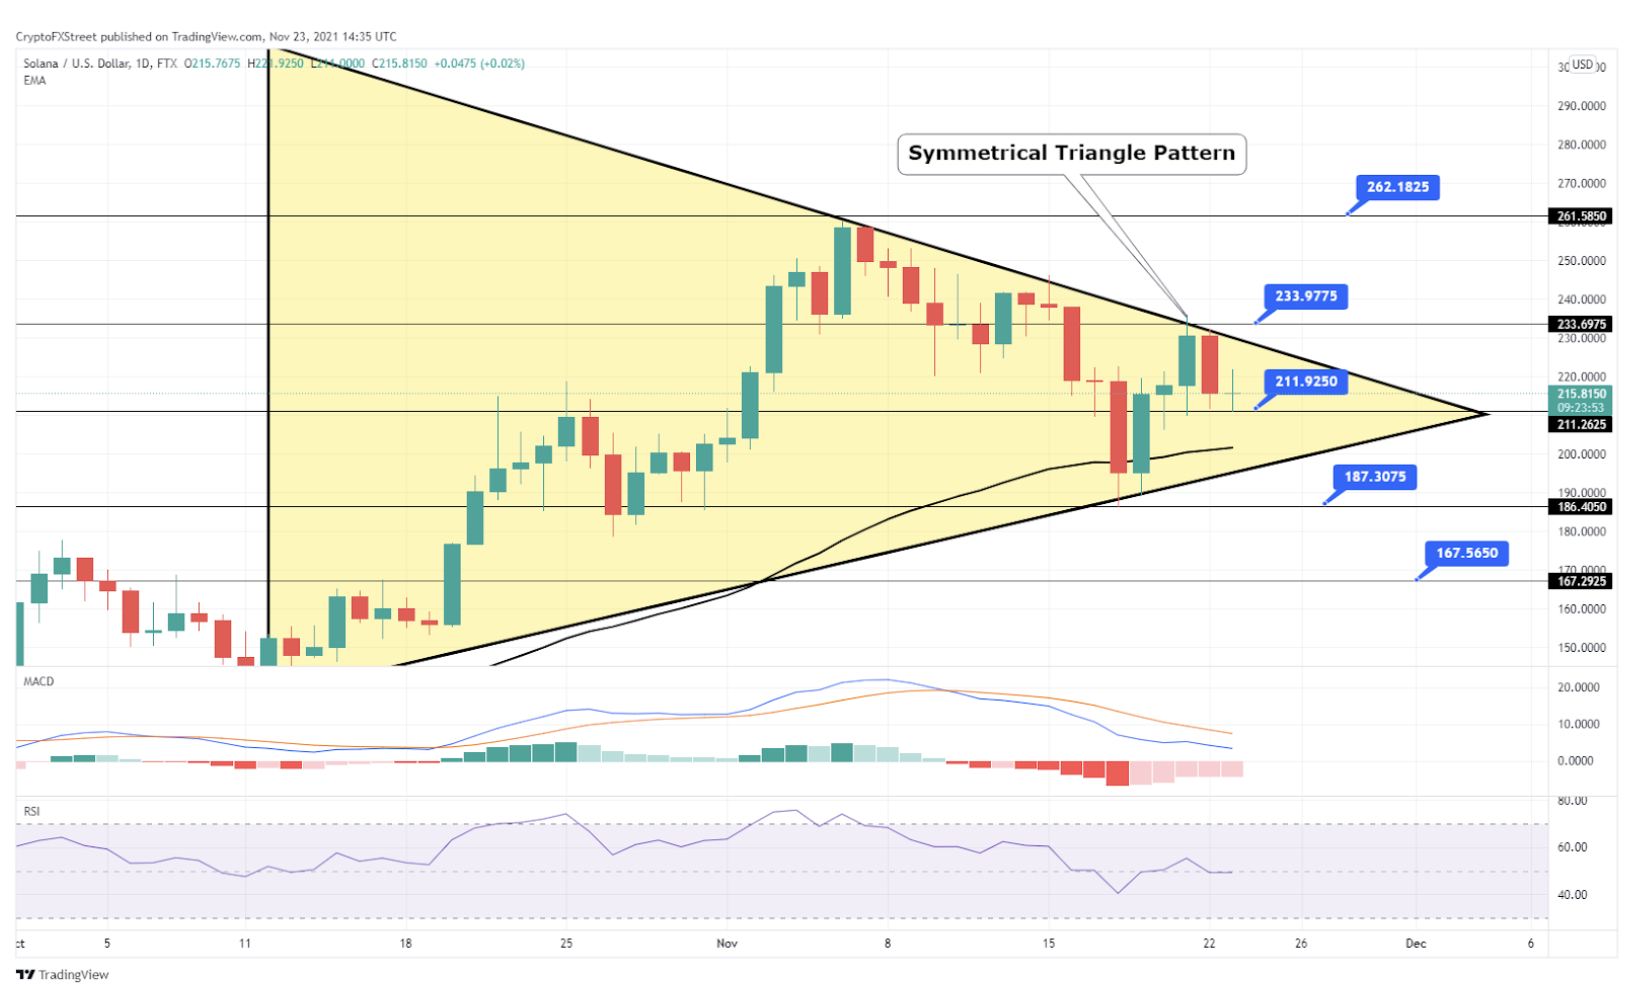
Solana (SOL) daily timeframe
On the other hand, Solana has closed a bearish engulfing candle at $234 as the downward trendline represents a substantial hurdle ahead. This type of candlestick pattern is usually succeeded by a downswing. For this reason, traders must pay close attention to the $211 support level as any signs of weakness can result in a correction to $187 or $167.
Information on these pages contains forward-looking statements that involve risks and uncertainties. Markets and instruments profiled on this page are for informational purposes only and should not in any way come across as a recommendation to buy or sell in these assets. You should do your own thorough research before making any investment decisions. FXStreet does not in any way guarantee that this information is free from mistakes, errors, or material misstatements. It also does not guarantee that this information is of a timely nature. Investing in Open Markets involves a great deal of risk, including the loss of all or a portion of your investment, as well as emotional distress. All risks, losses and costs associated with investing, including total loss of principal, are your responsibility. The views and opinions expressed in this article are those of the authors and do not necessarily reflect the official policy or position of FXStreet nor its advertisers. The author will not be held responsible for information that is found at the end of links posted on this page.
If not otherwise explicitly mentioned in the body of the article, at the time of writing, the author has no position in any stock mentioned in this article and no business relationship with any company mentioned. The author has not received compensation for writing this article, other than from FXStreet.
FXStreet and the author do not provide personalized recommendations. The author makes no representations as to the accuracy, completeness, or suitability of this information. FXStreet and the author will not be liable for any errors, omissions or any losses, injuries or damages arising from this information and its display or use. Errors and omissions excepted.
The author and FXStreet are not registered investment advisors and nothing in this article is intended to be investment advice.
Recommended Content
Editors’ Picks
Ripple's move above this key level could trigger nearly 50% rally for XRP
Ripple has overcome a critical resistance level and flipped into a support floor on the weekly time frame. This development happened while XRP tightly consolidated for roughly 250 days. Investors can expect XRP to kickstart a massive rally.
Optimism price outlook with nearly $90 million worth of OP tokens flooding markets on Friday
Optimism volatility has shrunk in the ours leading to the network’s cliff unlock. It joins the likes of dYdX and Sui, which have similar events on their calendars. As token unlocks are often considered bearish catalysts, investors should brace for a reaction after the event.
Top 3 Price Prediction Bitcoin, Ethereum, Ripple: Retail watches from the sidelines with a bias for shorts
Bitcoin could clear $73,777 peak as BTC bulls resurface. Ethereum might fall 10% before next leg up as ETH RSI teases with sell signal. XRP could lose $0.6000 threshold as Ripple bulls fail to show up.
Jito price could hit $6 as JTO coils up inside this bullish pattern
Jito price action shows a potential cup and handle formation. Based on theoretical measurement rules, a successful breakout could yield a 56% rally to $6.0. A breakdown of the $3.86 support level would create a lower low for JTO and invalidate the bullish thesis.
Bitcoin: BTC may have recovered, but is it out of the woods?
Bitcoin’s (BTC) upward momentum has shown a significant decline for the past two weeks or so. This development led to a bearish signal on the weekly and an uncertain outlook on the monthly.