Solana price to aim for new all-time high at $325 if bulls enter at critical support
- Solana price is drawing near a critical foothold that could decide the token’s fate in the near future.
- The Ethereum-killer must hold above $189 for hopes of a recovery and to reach a new all-time high.
- If SOL drops below the crucial support level, a 34% plunge could be on the radar.

Solana price is approaching a critical support level that could determine the near-term outlook for SOL. The Ethereum-killer continues to present a bullish outlook with its next optimistic target at $325, but if the crucial foothold fails to hold, the token could be at risk of a 34% decline.
Solana price prepares for steady recovery
Solana price has formed an ascending parallel channel on the 12-hour chart as SOL continues to print higher highs and higher lows. After dropping 25% from its all-time high, the Ethereum-killer is now drawing near a decisive support level at the lower boundary of the prevailing chart pattern at $189.
If Solana price manages to hold above this level, a recovery could be on the radar for the token. The governing technical pattern suggests that SOL could aim for the upper boundary of the chart pattern at $325, coinciding with the 127.2% Fibonacci retracement level.
However, before SOL bulls make their way up to the bullish target, a few obstacles may emerge. Solana price will be confronted with the first hurdle at the 100 twelve-hour Simple Moving Average (SMA) at $193, then at the 78.6% Fibonacci retracement level.
Further headwinds may appear at the 50 twelve-hour SMA at $222, then at the 21 twelve-hour SMA at $228 before Solana price confronts the middle boundary of the parallel channel at $237. An increase in sell orders could see SOL seek support nearby before the token meets the following obstacle at the MRI’s resistance line at $252.
The last hurdle for Solana price to overcome before approaching the bullish target is at its all-time high at $259.
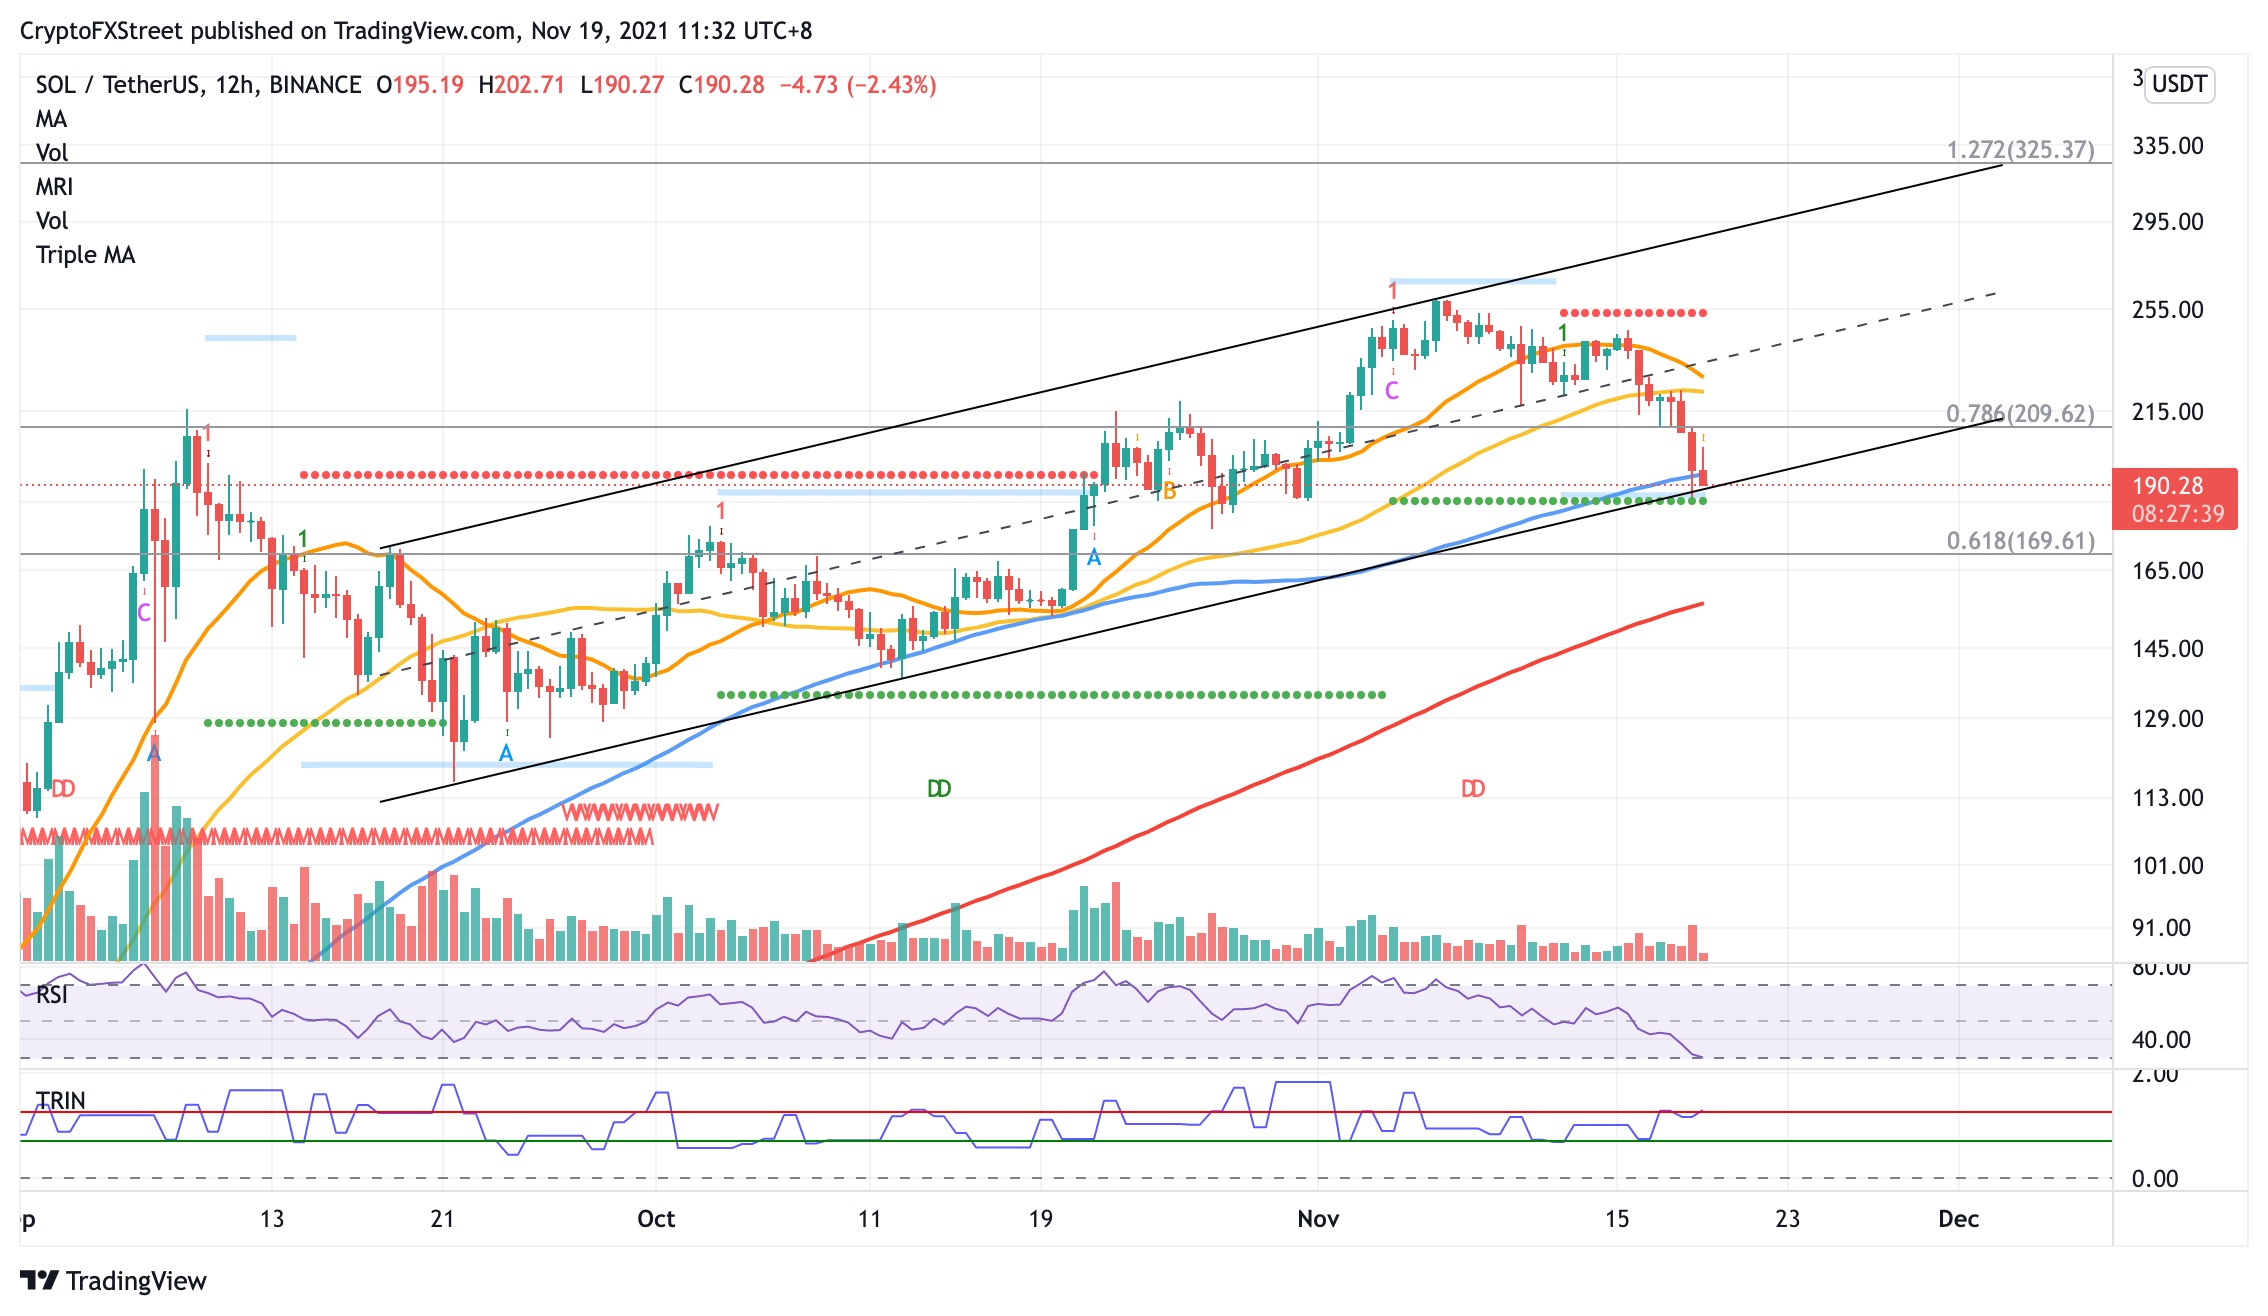
SOL/USDT 12-hour chart
If the bears manage to take control of the market, Solana price may drop further toward the support line given by the Momentum Reversal Indicator (MRI), suggesting that an additional foothold will emerge at $186 if SOL falls below the lower boundary of the parallel channel.
If Solana price plunges below $189- $186, the bullish outlook would be voided and SOL investors could expect further losses and even put a 34% decline on the radar given by the bearish target of the prevailing chart pattern at $140.
Author

Sarah Tran
Independent Analyst
Sarah has closely followed the growth of blockchain technology and its adoption since 2016.


