Solana price prints a bull trap for investors; 25% losses in sight for SOL
- Solana price trades within a pattern from which a breakout is expected.
- Despite a bullish price action, the technical formation hints at an incoming reversal to $15.19 for SOL.
- This bearish outlook will be invalidated after a daily candlestick close above the chart pattern's upper boundary at $26.74.
Solana (SOL) price is trading with a bullish bias on the daily and lower timeframes, printing green candlesticks that could be misleading to the naked eye. However, a closer look at the price action suggests an incoming reversal with a governing technical formation that suggests the same.
Also Read: Solana Metaplex fees could push developers back to Ethereum
Solana price prepares for a possible 20% reversal
Solana (SOL) price is up 10% in the last four days as bulls lead the market with four consecutive green candlesticks to record an intra-day high of $20.79 on May 28 as of press time. At the time of writing, the Ethereum killer is auctioning at $20.47, a daily rise of 5%. With this bullish outlook, however, the price action hints at a possible reversal as it consolidates within a rising or ascending wedge pattern.
The ascending wedge pattern forms when an asset's price action moves between two upward-sloping, converging trendlines. The narrowing wedge shape is created as the price action oscillates between the support and resistance trendlines, ultimately converging at the apex.
The support trendline is drawn by connecting a series of higher lows, while the resistance trendline is drawn by connecting a series of lower highs. As the trendlines converge, they create an upward-sloping wedge shape. The pattern's breakout occurs when the price action breaches either the support or the resistance trendline, signaling a potential reversal or continuation of the current trend.
Often, this technical formation proves bearish, and Solana price could break below the support trendline. An increase in buyer momentum could see Solana price ascend further, potentially flipping the resistances due to the $100- and 50-day Simple Moving Averages (SMA) at $21.48 and $21.65, respectively, before targeting the upper boundary of the chart at $25.67.
However, Solana price would have to break above the $26.74 resistance level to invalidate the bearish thesis. Conservative investors should wait for confirmation above this level for long positions.
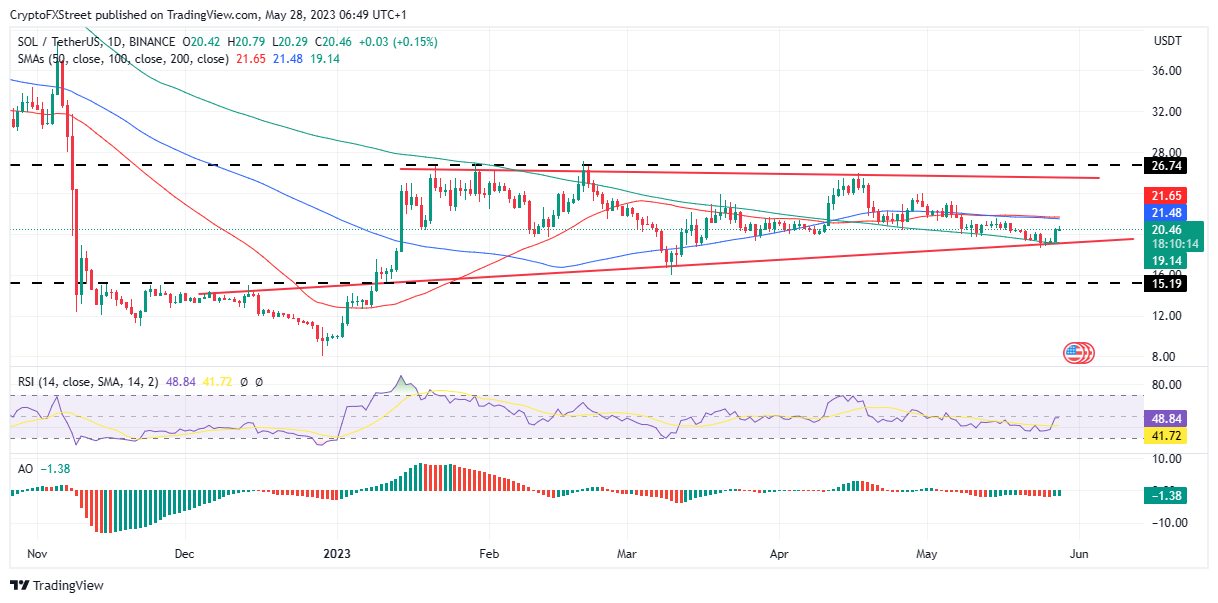
SOL/USDT 1-day chart
Otherwise, Solana price lacks sufficient momentum to sustain the uptrend and could reverse soon. In such a case, SOL could break below the lower boundary of the rising wedge or extend lower to tag the $15.19 support level in the dire case. Such a move would denote a 25% downswing from the current level.
To support this postulation, the Relative Strength Index (RSI) was still below the midline, deflecting, suggesting a repulsion. Moreover, the Awesome Oscillators (AO) were also in the negative zone, suggesting bears dominated the SOL market.
Also Read: Hong Kong leaves the door open to Ethereum killers Cardano, Solana, AVAX, MATIC and LINK
Author

Lockridge Okoth
FXStreet
Lockridge is a believer in the transformative power of crypto and the blockchain industry.


