Solana bulls push for a retest of $174 by end of next week
- Solana price action has a lot of distribution at $120 with bulls not giving up their interest in further upside.
- Bulls have been successful in squeezing a few bears out of their intermediary position at $145.
- The downtrend is still intact but is starting to fade, which should attract more buyers to step in.

Solana (SOL) price has been trending lower after buyers got caught in a bull trap at $174, which fell in line with the 23.6% Fibonacci level. Bulls have attempted Sunday and Monday to overcome the downtrend with that downtrend, ramping up SOL price action back to $150. This must have squeezed a few bears out of their positions and hands bulls an opportunity to finish the current downtrend.
Bulls have shot a hole in the downtrend wall of Solana price
Solana price has been on a downtrend since September 19. Bulls are trying to break out of the downtrend and have made a blow to the bears' strategy this past Sunday and Monday. Bulls were able to defend the 50% Fibonacci level at $121.67. Price action in SOL bounced off that level and technically hit the purple descending trend line to the tick.
In the move upwards, bulls were not only able to break above the 38.2% Fibonacci level but as well above the monthly R1 resistance level at $150. With some intermediary bears having shorted around the Fibonacci level and with their stops hidden just above $150, certainly some stops have been run by bulls, and a few bears have been shut out of their positions.
SOL price downtrend is losing steam and starts to fade as those stopped out bears will not be returning anytime soon. They will not risk being stopped out again at the same levels. They will stay out of any short positions, which makes the downtrend run dry of volume.
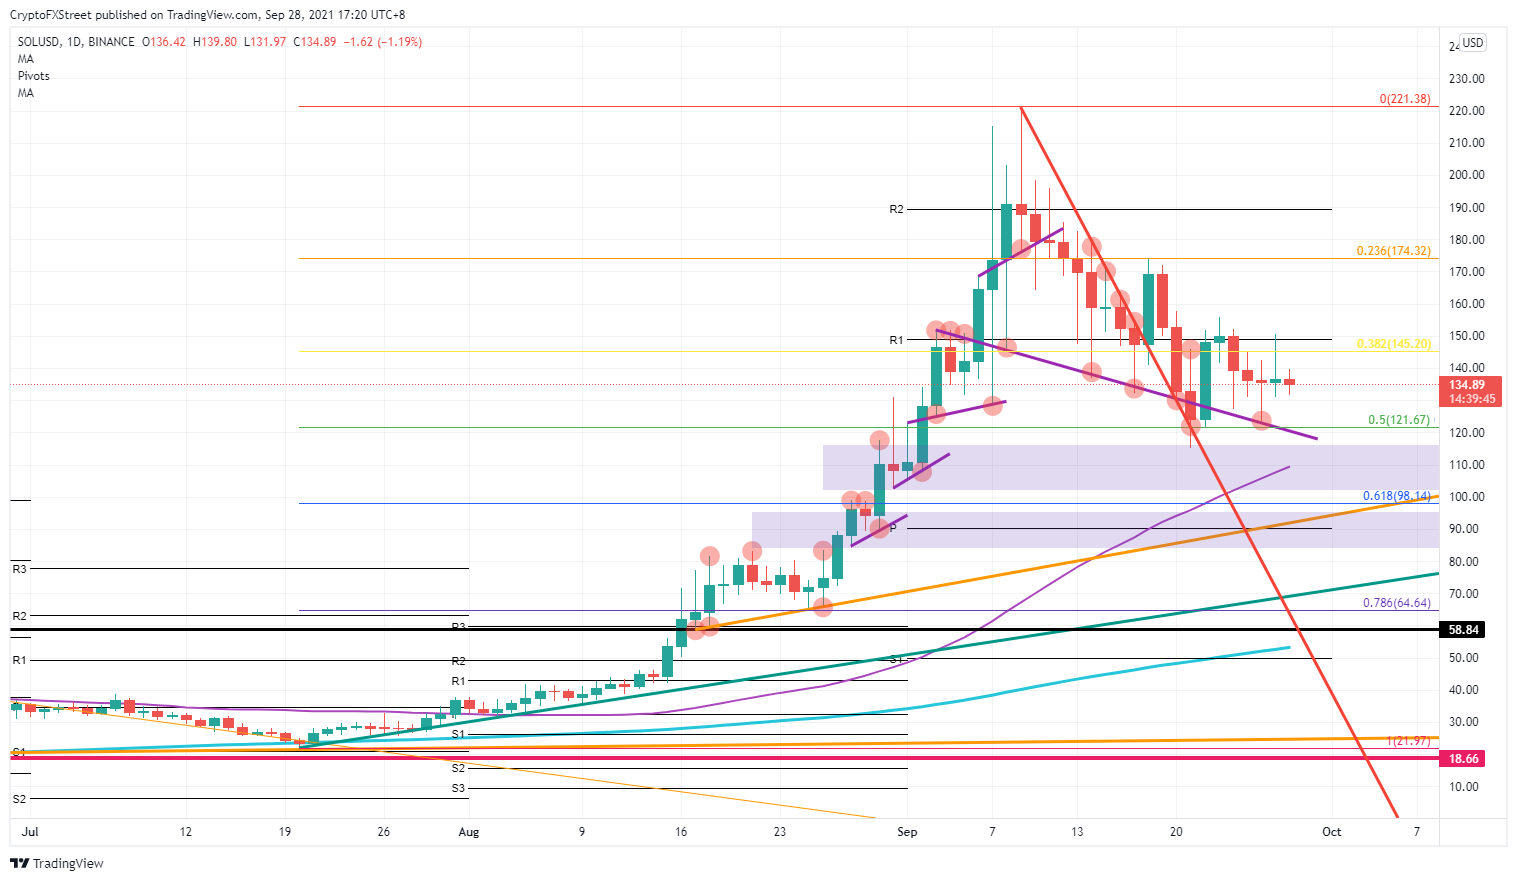
XRP/USD daily chart
As Solana bulls have smelled opportunity, expect a retest on the R1 monthly resistance level at $150. Bulls will not face much resistance this time as many of the sellers will already have left this region. This should open the road for bulls to go to $174.32, or the 23.6% Fibonacci level.
With the market's mood a bit in doubt, a negative downturn in overall market sentiment could give the bears the upper hand again and drive price action in SOL back below the 50% Fibonacci level, below $121.67.
Like this article? Help us with some feedback by answering this survey:
Author

Filip Lagaart
FXStreet
Filip Lagaart is a former sales/trader with over 15 years of financial markets expertise under its belt.



