Solana Price Prediction: SOL flashes 2.8B bearish trend amid hawkish Fed fears
- Solana price plunged 5% on Monday, trading below the $170 mark for the first time in 68 days.
- Solana trading volumes surged 2.8 billion SOL (from 1.54 billion to 4.35 billion) in the last 24 hours, coinciding with an increase in negative media comments.
- Technical indicators suggest the over-supplied SOL market could succumb to further price cuts before finding support.

Solana price plunged 5% on Monday, trading below the $170 mark for the first time since November 2024. On-chain data shows that SOL’s latest dip coincided with a negative swing in market sentiment. Is SOL price hinting at further downside risks?
Solana price plunges to 68-day low as crypto markets tumble
Solana (SOL) nosedived to a two-month low on Monday, mirroring the broader cryptocurrency market’s turbulent start to the week.
The plunge comes as traders brace for crucial inflation data and navigate hawkish monetary policy signals, while geopolitical risks like renewed trade tensions weigh on sentiment.
Bitcoin dropped to $90,600 and Ethereum retraced to $3,100, reflecting bearish momentum across key assets.
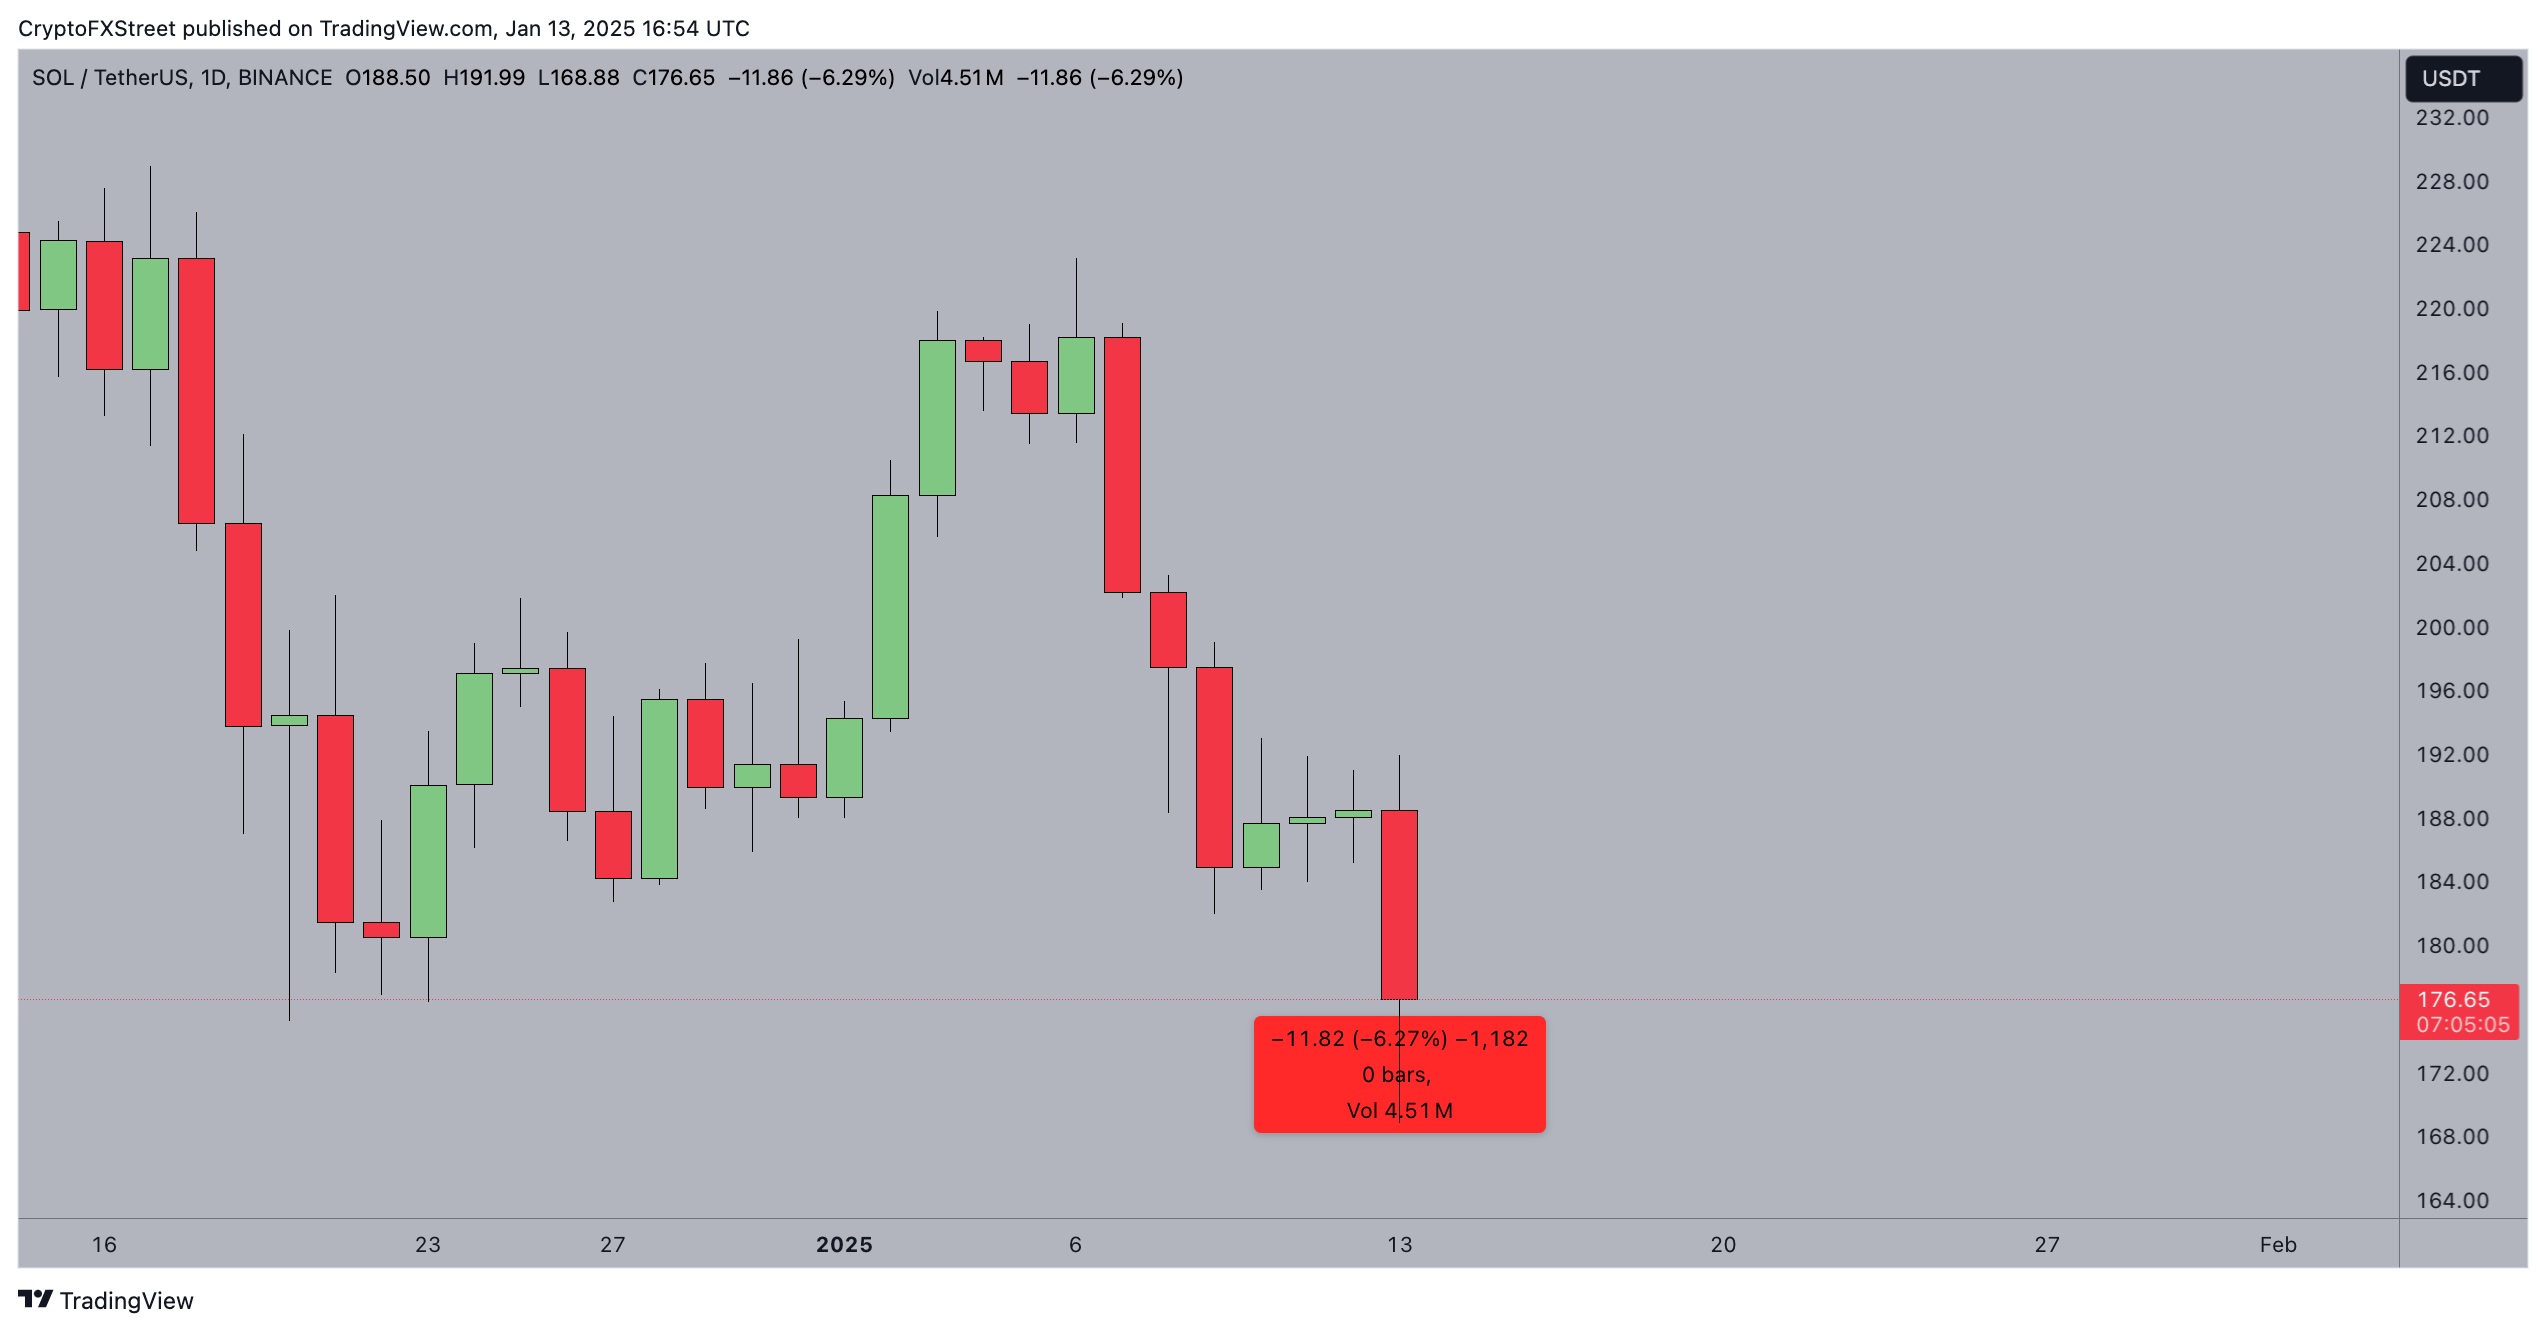
At press time, Solana is trading at $176.93, a steep 6.14% decline over the last 24 hours.
The token briefly hit $168 earlier in the session, marking its lowest level since November 6, 2024.
This 68-day low highlights ongoing selling pressure, particularly as trading volumes remain elevated, surpassing 4.59 million.
The extended downward shadow of Monday’s candlestick suggests weakening support levels, posing risks for further declines if bearish sentiment persists.
Negative sentiment sparks 2.8 billion SOL increase in sell pressure
Solana's underwhelming price performance on Monday mirrors the broader market sentiment.
However, the on-chain data trend shows SOL's latest downtrend coincided with a dramatic spike in market supply, a move that could trigger further downside or impede early breakout attempts.
In affirmation of this narrative, the Santiment chart below compares Solana’s daily Trading Volume against Weighted Sentiment —the balance between negative and positive comments surrounding a cryptocurrency project.
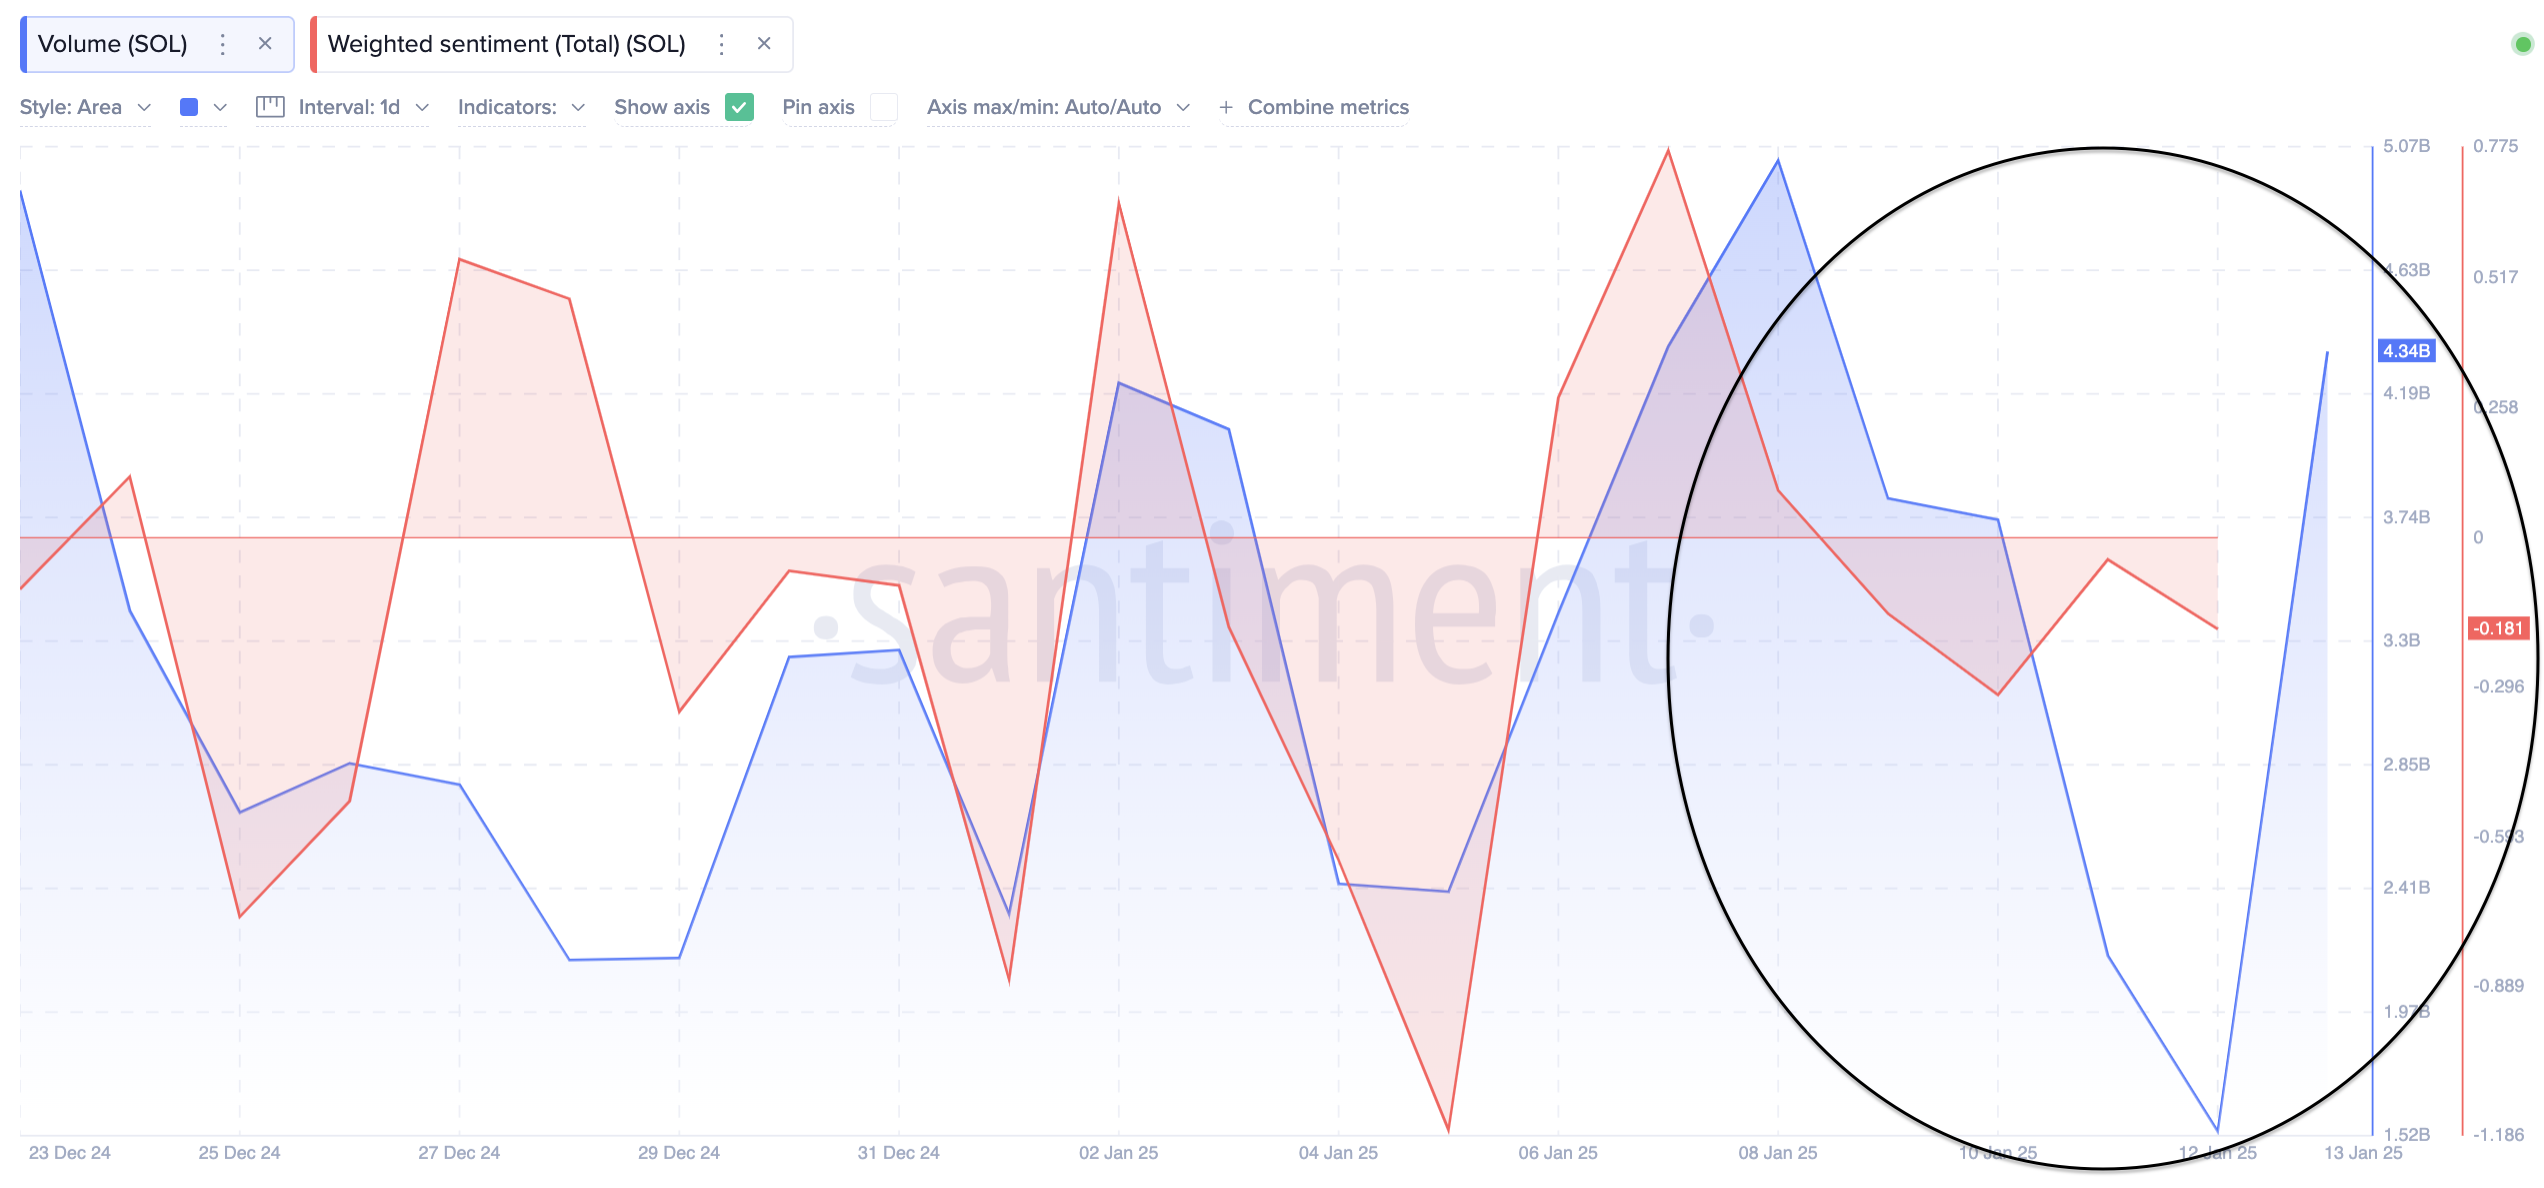
The blue line depicts how Solana’s trading volume surged by 2.8 billion in the last 24 hours, rising from 1.54 Billion SOL on Sunday to 4.35 billion SOL on Monday.
More so, this 90% spike in market supply has coincided with SOL Weighted Sentiment plunging further to negative values of -0.18 at press time on Monday.
When market volumes surge during a spike in negative comments as observed in the SOL on-chain trends, it signals that market participants are backing up their bearish concerns with active sell-side pressure.
While Solana currently trades at $176, having briefly tested the $168 level during the day, bears could anticipate weakened support levels below and pile on additional short positions in the days ahead.
Solana Price Forecast: $170 support at risk
Solana (SOL) plunged 6.19% to $176.85, marking a substantial bearish continuation after a rejection near $196.54 (upper Bollinger Band).
The current price is below the 20-day moving average, which indicates weakened bullish momentum. With a daily trading volume of 4.68 million, the rising activity signals aggressive selling pressure.
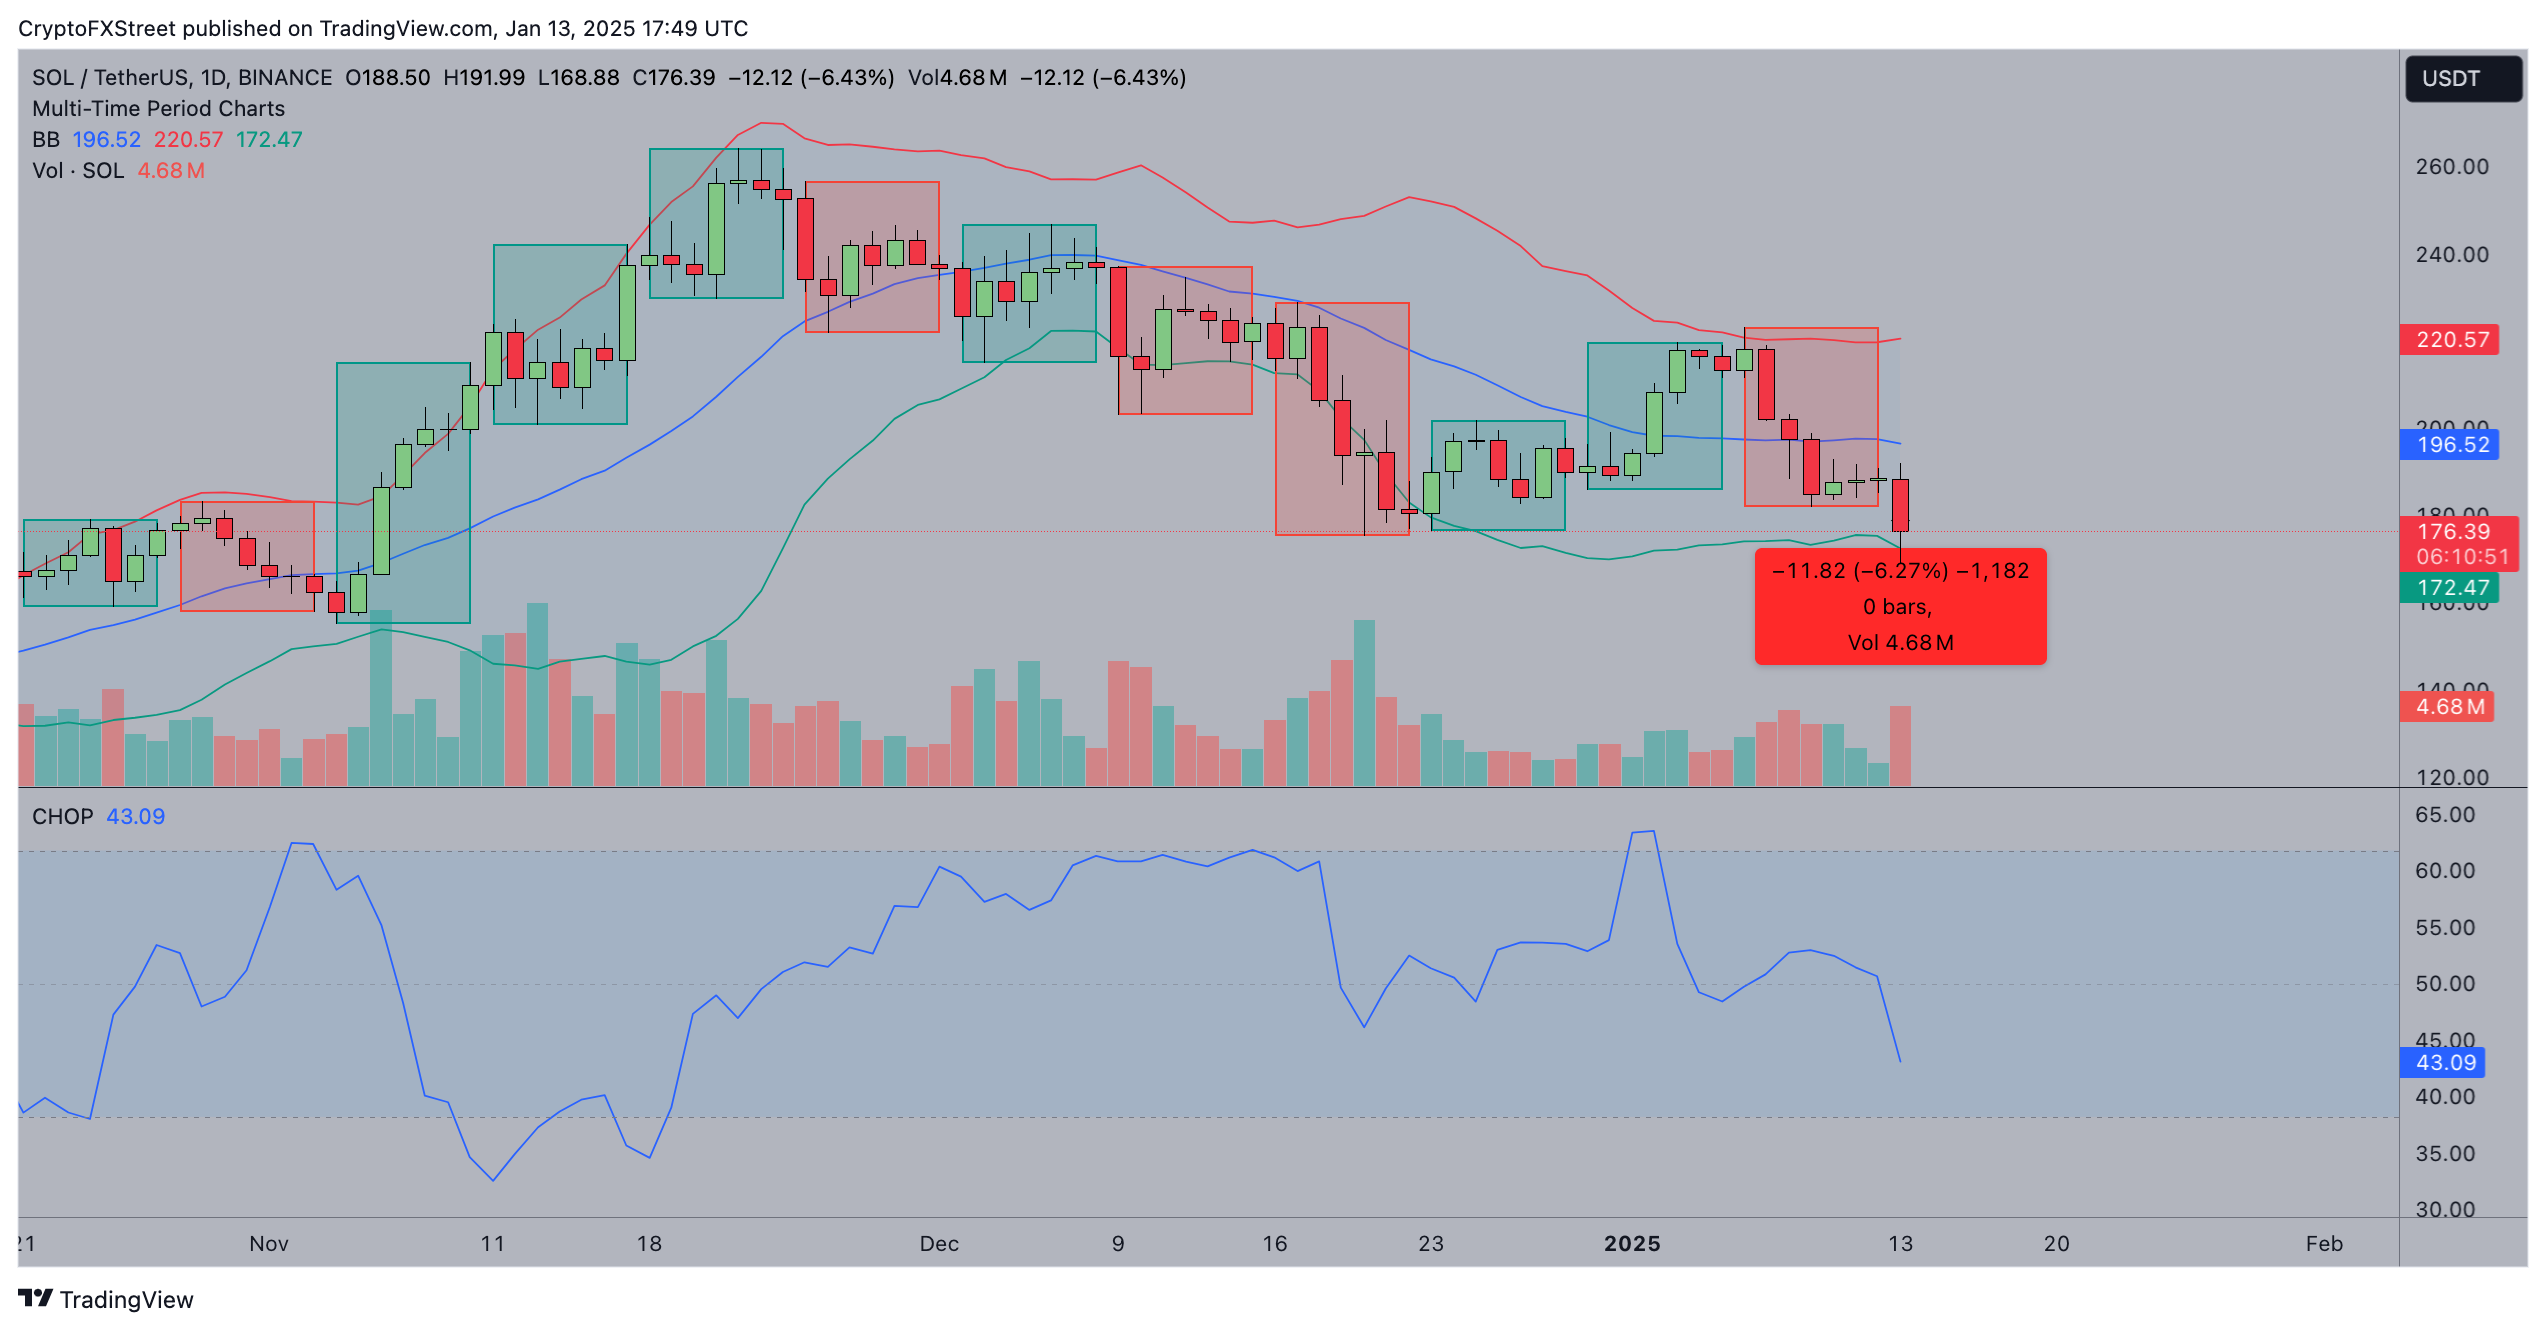
The Choppiness Index (CHOP) reading of 43.09 suggests the market remains moderately directional.
If bearish sentiment intensifies, SOL risks breaching the $172.57 lower Bollinger Band, exposing $170 as the next critical support level.
A break below $170 could invite accelerated selling, driving the price toward $150.
However, should Solana defend the $172 support zone, a rebound towards the $196.54 resistance level remains plausible.
Such a move would depend on broader market recovery and improving sentiment.
The Bollinger Band's widening range indicates potential volatility ahead, leaving the short-term bias tilted bearish but subject to sharp reversals if momentum shifts.
Author

Ibrahim Ajibade
FXStreet
Ibrahim Ajibade is an accomplished Crypto markets Reporter who began his career in commercial banking. He holds a BSc, Economics, from University of Ibadan.


