Aave Price Forecast: AAVE tests channel resistance as ParaFi Capital deposit, bearish derivatives data caps upside
- Aave price faces rejection around the upper boundary of a falling channel pattern on Tuesday.
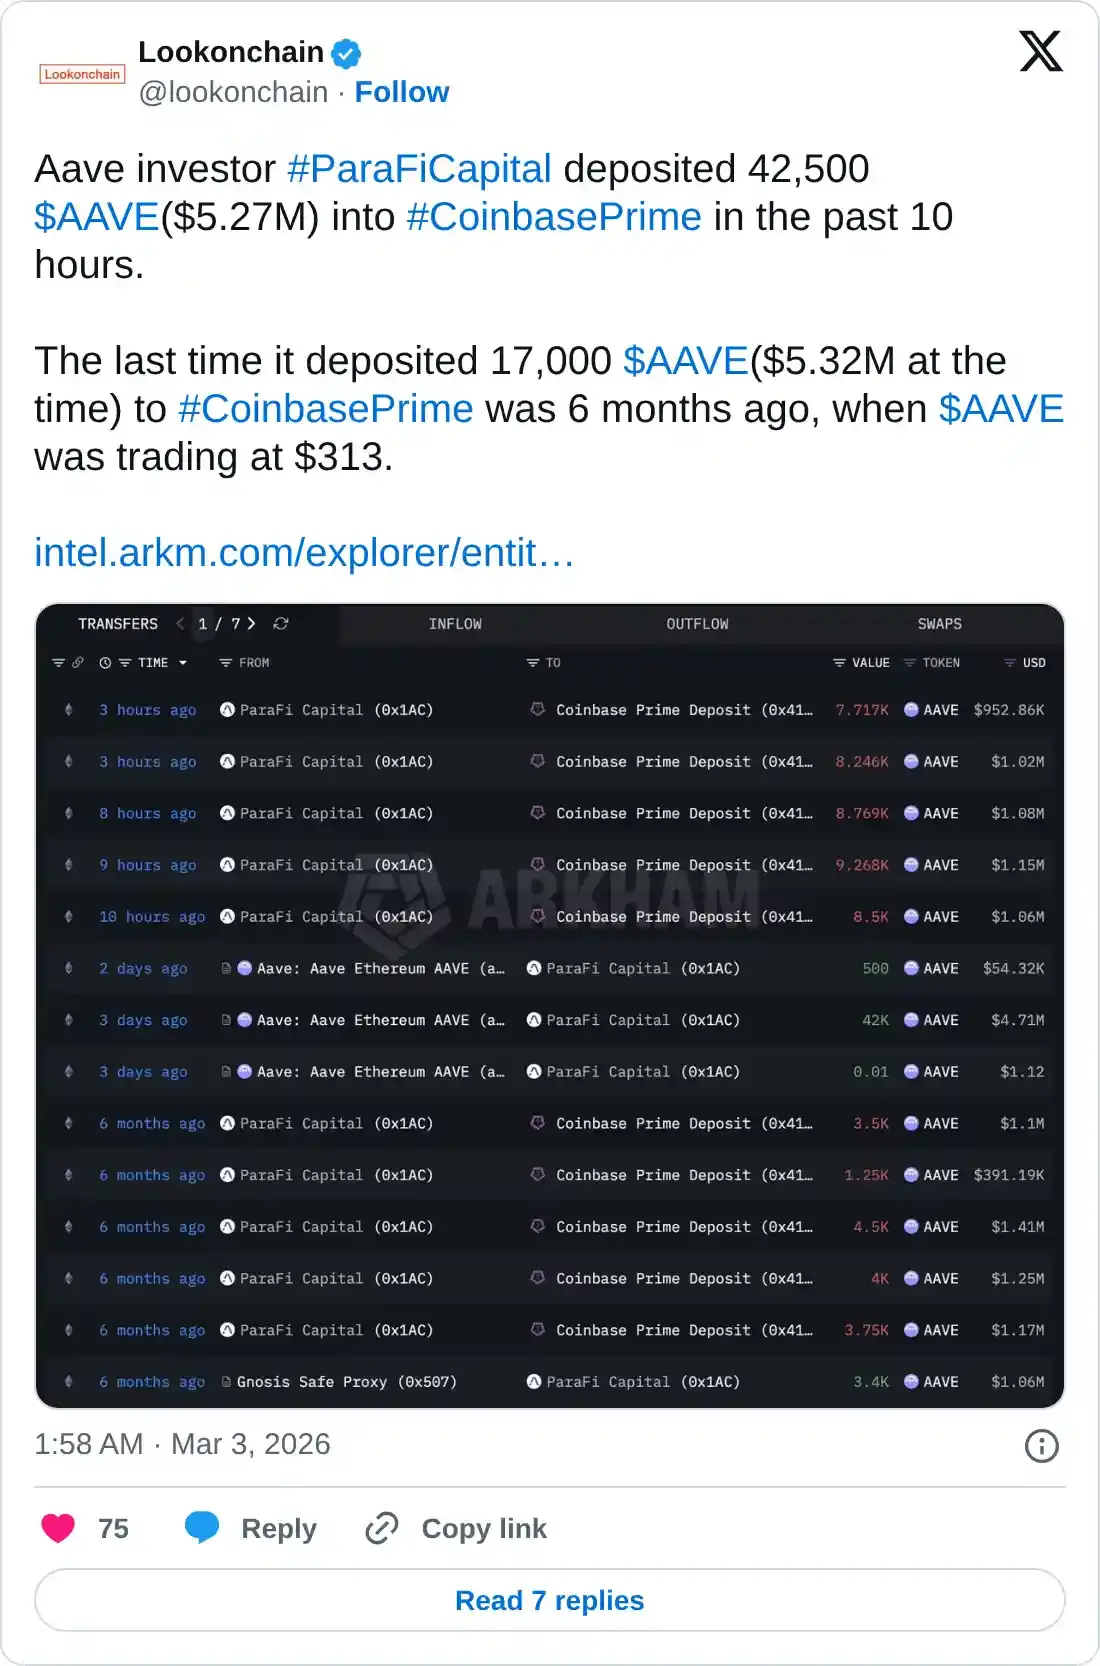
- Lookonchain data shows that AAVE investor ParaFi Capital deposited 42,000 tokens into Coinbase Prime in the past 10 hours.
- Derivatives data paints a bearish picture, with funding rates negative and short bets rising.

Aave (AAVE) trades around $120 on Tuesday, testing the channel resistance, signaling that sellers remain active in the zone. Lookonchain data shows that ParaFi Capital transferred 42,000 AAVE tokens to Coinbase Prime over the past 10 hours, often interpreted as a potential selling signal. Meanwhile, the derivatives metrics underscore the cautious tone with funding rates negative and short bets rising among traders.
ParaFi Capital transfer and negative funding rates support bearish sentiment
On-chain tracker Lookonchain reported that Aave investor ParaFi Capital transferred 42,000 AAVE tokens, worth $5.27 million, to Coinbase Prime over the past 10 hours. Exchange-linked deposits are often interpreted as a potential signal of selling intent, which could increase selling pressure on AAVE.
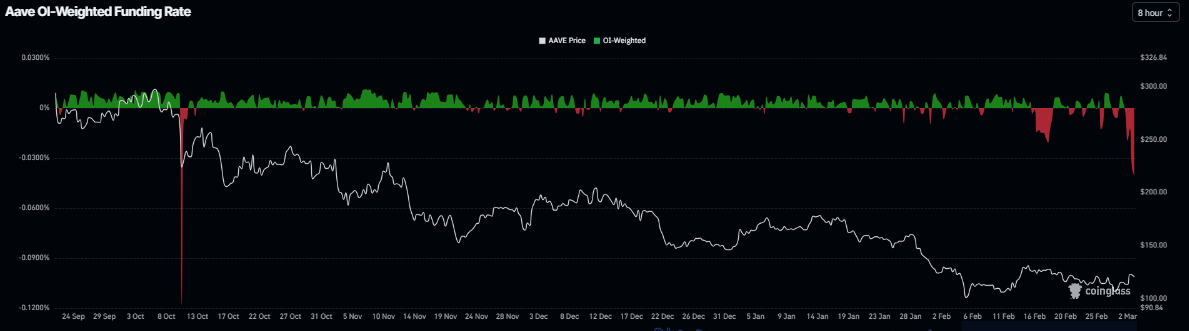
On the derivatives side, CoinGlass funding rate data projects a bearish outlook for AAVE. The metric flipped to a negative rate on Monday and stands at -0.040% on Tuesday, the lowest level since October 11 and nearing levels seen during the October 10 market dip. These negative rates indicate shorts are paying longs, suggesting bearish sentiment toward AAVE.
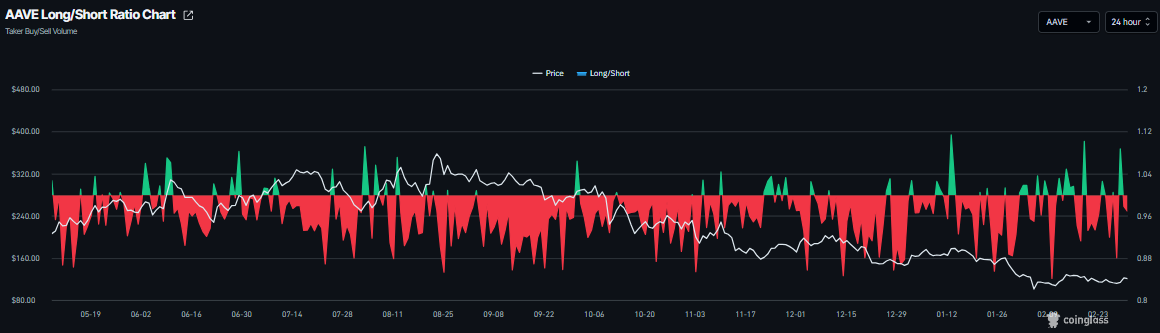
In addition, Aave’s long-to-short ratio reads 0.97 on Tuesday. This ratio below 1 indicates bearish sentiment as traders are betting on the Aave price to fall.
AAVE Price Forecast: Channel boundary could hold as resistance
Aave price is trading at $120.40 as of Tuesday. The pair holds a mild bullish near-term bias after rebounding from the lower half of the established descending channel, with price now pressing above the mid-zone toward the channel’s upper boundary near $124.00.
The 50-day and 100-day Exponential Moving Averages (EMAs) remain well above spot and slope lower, which keeps the broader trend negative, but the recovery within the channel is backed by improving momentum.
The Relative Strength Index (RSI) on the daily chart hovers just below 50, signaling fading bearish pressure, while the Moving Average Convergence Divergence (MACD) line stays above its signal line and in positive territory with a modest positive histogram, suggesting buyers retain short-term control.
Initial resistance is found at the channel top around $124.00, followed by the horizontal barrier at $142.69, where the declining moving averages would also begin to weigh against further gains.
A clear break above $124.00 could open the way for a further recovery toward the $140.00–$142.69 region.
On the downside, immediate support stands at $114.00, ahead of the horizontal support at $110.50 that coincides with the lower half of the channel, and a loss of this area would expose the descending channel floor, currently projected toward the mid-$80s over time.
As long as AAVE holds above $110.50, the short-term recovery theme within the broader downtrend remains in place.
(The technical analysis of this story was written with the help of an AI tool.)
Author

Manish Chhetri
FXStreet
Manish Chhetri is a crypto specialist with over four years of experience in the cryptocurrency industry.



