Solana price ponders a 13.50% bullish move
- Solana price prints a bullish picture while aiming for a move to $38.00.
- The MACD indicator flashes a buy signal on the four-hour chart, calling buyers to rally support.
- The resistance between $35.00 and $36.00 may invalidate an incoming Solana price breakout.

Solana price continues to embrace support from an ascending trend line while reaching for a bullish breakout that may tag $38.00. All eyes are glued to its ability to crack the seller concentration area at $35.00, which might pave the way for a sustainable recovery.
Solana price is on the cusp of a major breakout
Solana price started gaining momentum after bears respected confluence support around $33.00. Hosted within this area are the 200-day SMA (Simple Moving Average – purple), the 100-day SMA (blue) and the 50 SMA-day (red). It is worth mentioning that SOL’s forming uptrend enjoys the support of a rising trend line, which has been in place since September 22.
The MACD (Moving Average Convergence Divergence) indicator’s position above the mean line mirrors growing buyer aggression. Solana price resumed the uptrend as soon as the 12-day EMA (Exponential Moving Average – blue) lifted above the 26-day EMA (red). Now, buyers should focus on reclaiming ground above $35.00 to avoid possible bull traps and uphold Solana price’s move to $38.00.
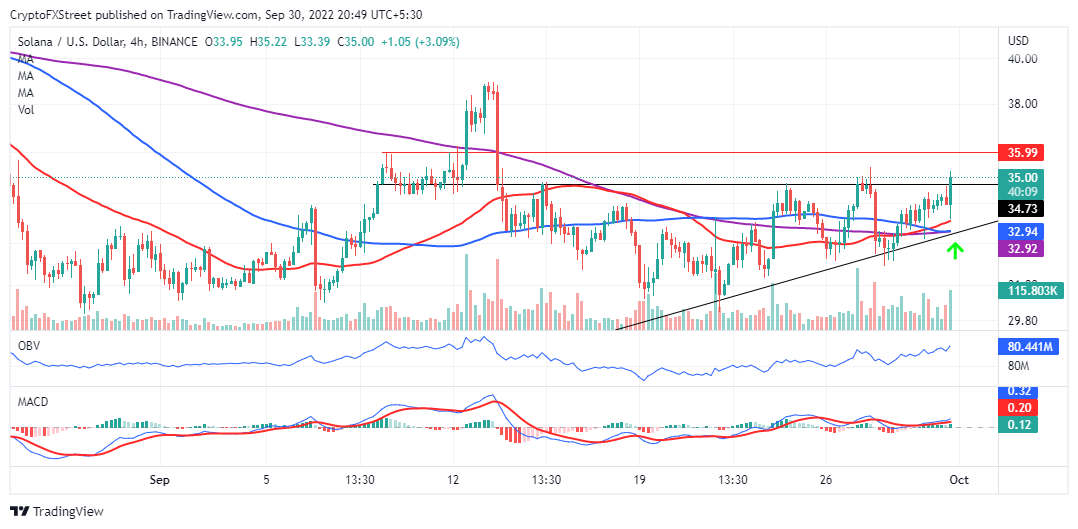
SOL/USD four-hour chart
The OBV (On Balance Volume) on the same four-hour chart reinforces an emerging bullish influence. In other words, buyers seem to have more strength than sellers, as observed from the index’s consistent upward movement from the $79.65 million volume on September 19 to the prevailing $80.42 million.
Solana price may invalidate the uptrend in the region between $35.00 and $36.00. Buyers struggled to clear the same region early this month as SOL pushed to $38.00. Traders should consider exiting from their positions at $36.00 because failure to break out to $38.00 could result in a sharp trend correction.
SOL does not have a shortage of possible downside price targets (support area). The confluence support at $33.00, the rising trend line and the major support between $30.00 and $31.00 may come into play to thwart bearish advances to $26.00.
Author

John Isige
FXStreet
John Isige is a seasoned cryptocurrency journalist and markets analyst committed to delivering high-quality, actionable insights tailored to traders, investors, and crypto enthusiasts. He enjoys deep dives into emerging Web3 tren


