Solana price must breach this level for SOL to enter a new bull run
- Solana price is close to confirming a massive sell-off.
- Time cycles suggest that a change in direction is coming up – but not until March 21.
- Bulls have a tough road ahead to invalidate any bearish price action.

Solana price is very close to breaking down below one of the strongest bearish patterns in technical analysis: the descending triangle. If sellers can take control and push Solana below the formation, a 40% wipeout is very likely to occur.
Solana price at risk of another major sell-off, but time cycles point to a major rally ahead
Solana price is just a hair away from completing one of the largest percentage drops since its all-time high formed back in November 2021. Its final support level at $80, if broken, could signal a fast crash down to the upper range of the extended 2021 Volume Point Of Control and the 100% Fibonacci expansion in the $50 value area.
If buyers want to invalidate any near-term bearish outlook, they need to close Solana price at or above $102. A close at $102 would put Solana above the single largest collection of resistance levels near its present value. Those resistance levels are:
- The daily Kijun-Sen at $91
- The 50% Fibonacci retracement at $92
- The daily Tenkan-Sen at $93
- The upper trendline of the descending triangle at $98.
- The recent swing high close at $100.
Bulls will achieve a significant step in the road to a new bull run if they can close Solana price at or above $102. However, at $111, the bottom of the Ichimoku Cloud (Senkou Span A) and the 38.2% Fibonacci retracement may halt further advancement. However, the breach of such a vast collection of resistance levels below $102 would likely create a substantial future support zone for bulls in the near future.
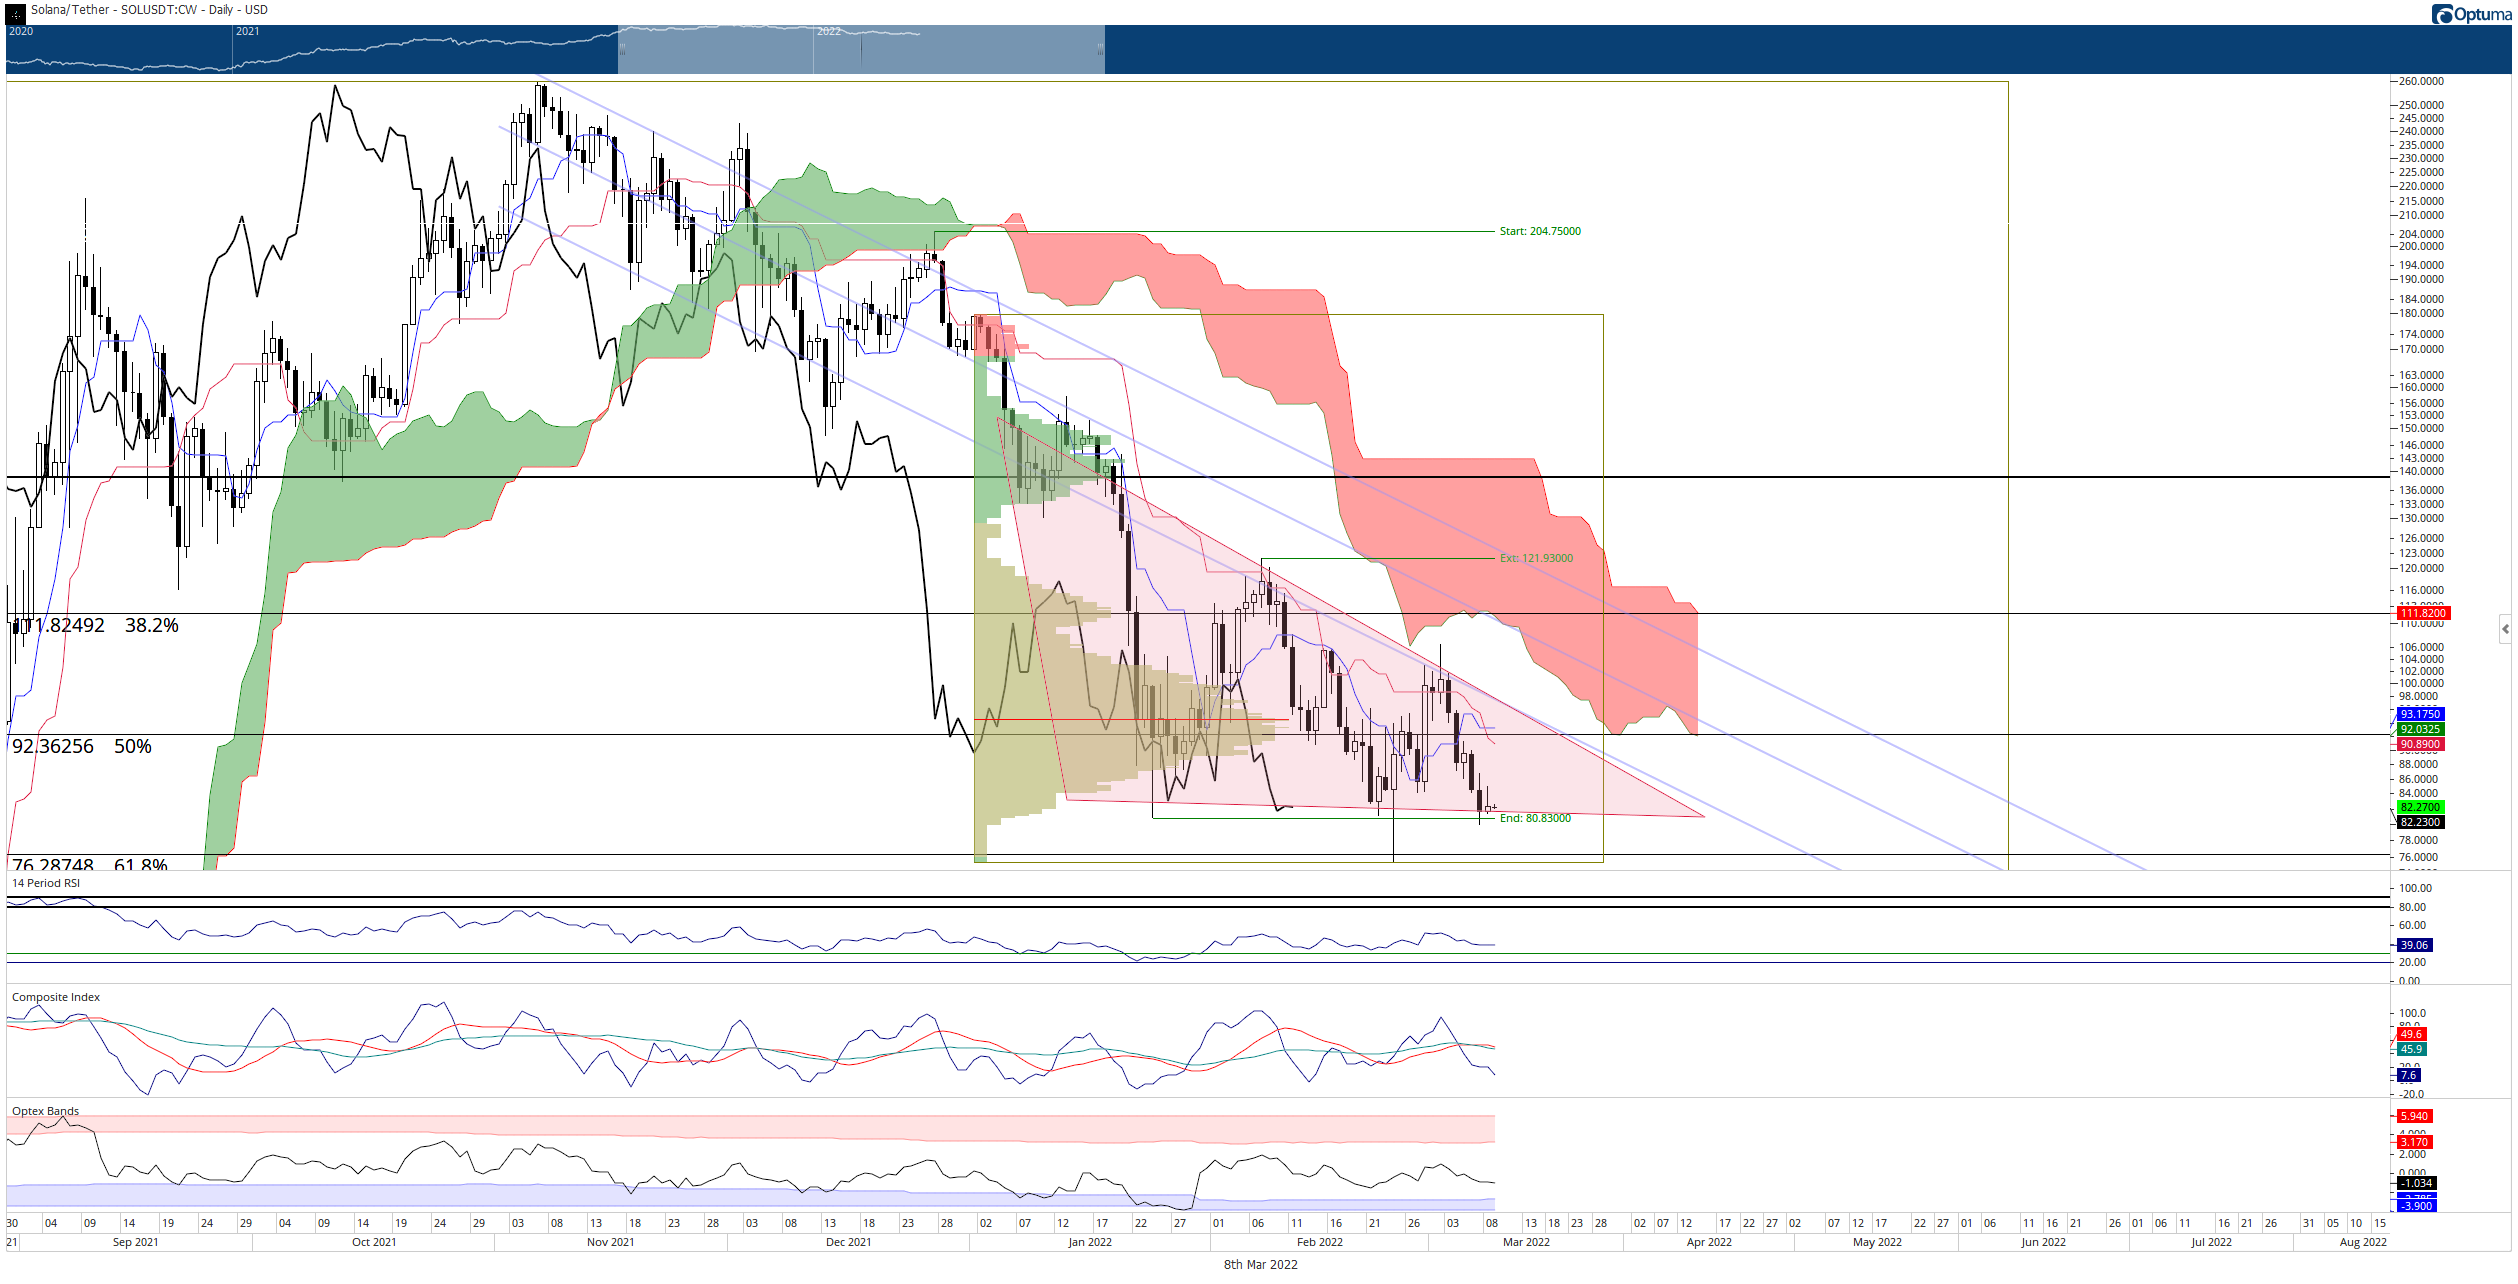
SOL/USDT Daily Ichimoku Kinko Hyo Chart
From a time cycle perspective, the Gann Season date of March 21 is quickly approaching. The March 21 date is historically a launching point for major bullish and bearish rallies for cryptocurrencies. If a market has trended lower near March 21, the subsequent price action will likely turn bullish.
Author

Jonathan Morgan
Independent Analyst
Jonathan has been working as an Independent future, forex, and cryptocurrency trader and analyst for 8 years. He also has been writing for the past 5 years.



