Solana Price Forecast: SOL tumbles to five-month low as ETF inflows and sentiment weaken
- Solana trades below $150 after a 5% drop on Thursday, marking its lowest daily close in the last five months.
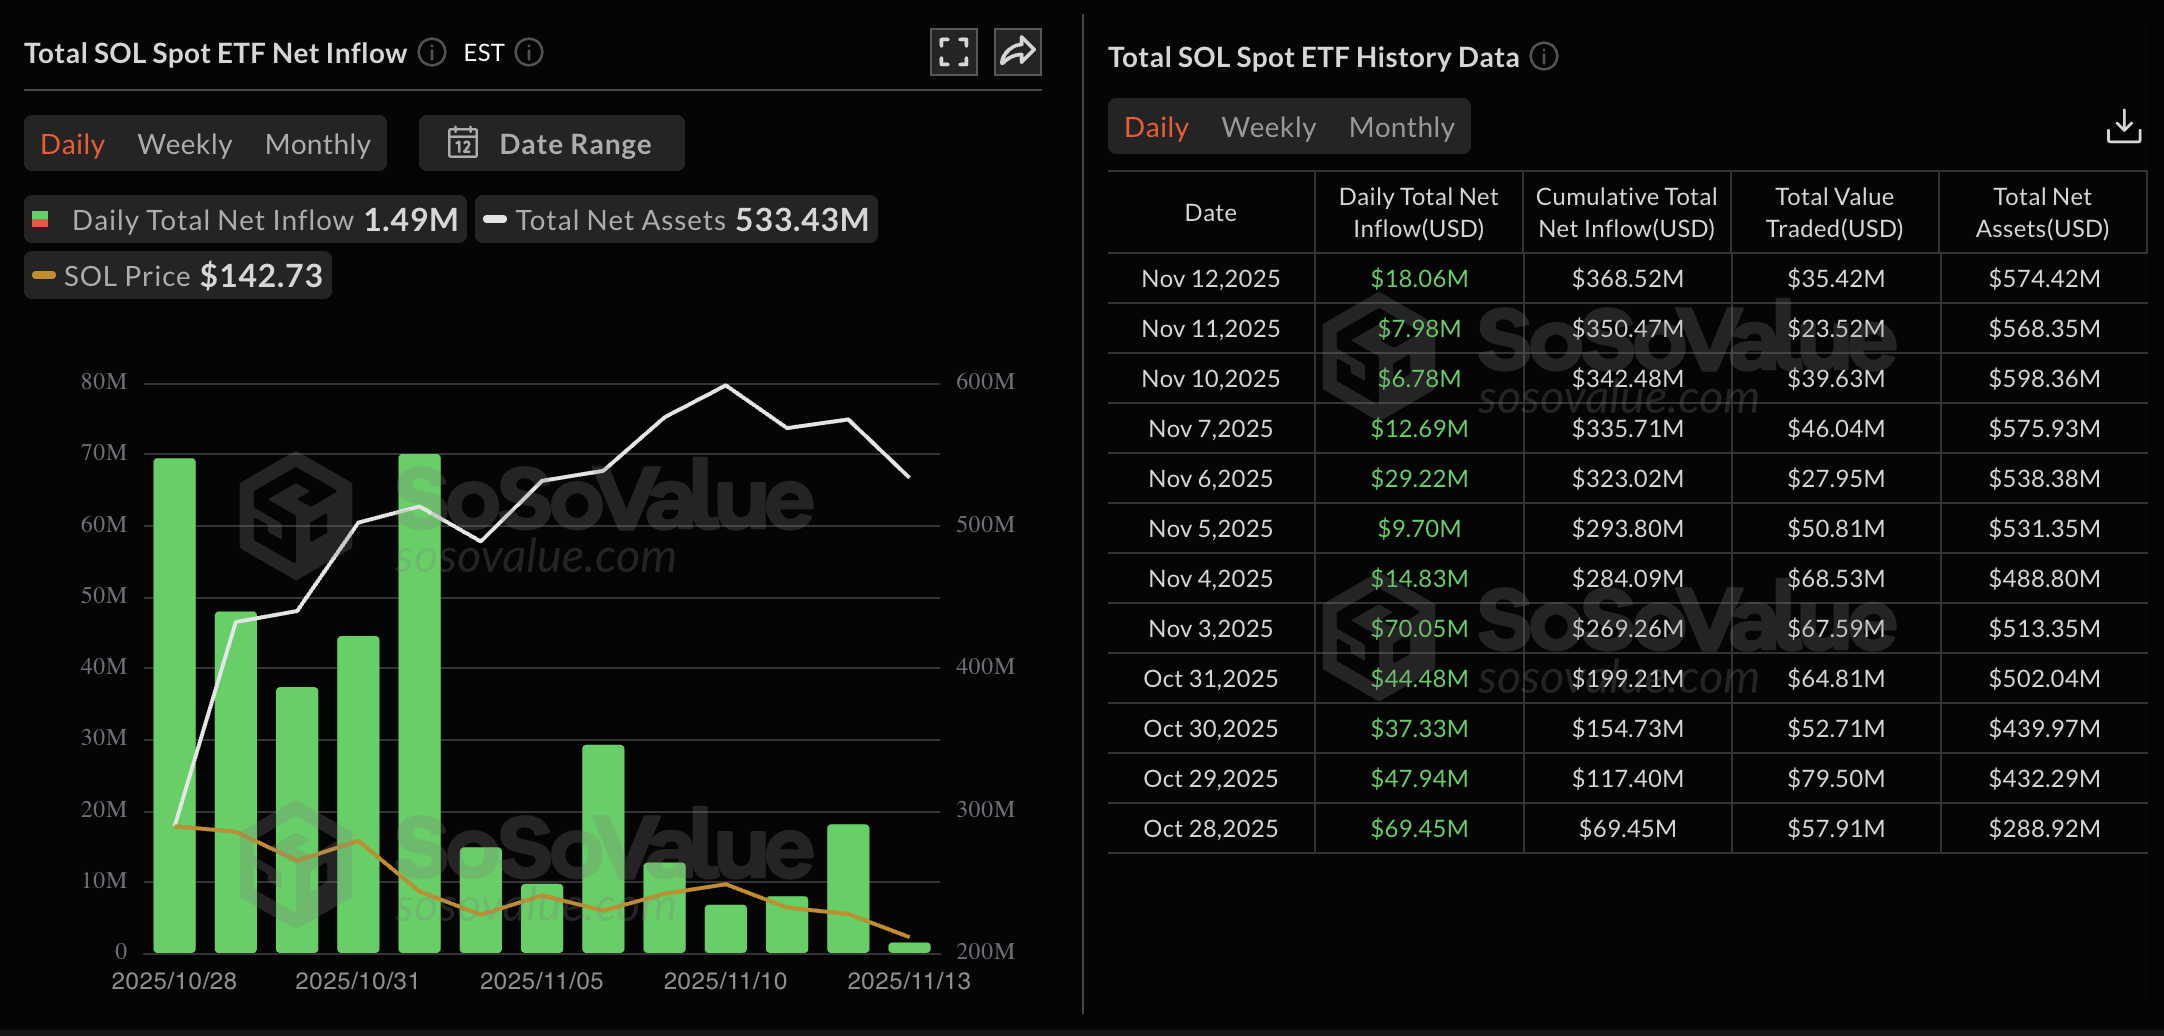
- Institutional demand wanes as US spot Solana ETFs record the lowest daily inflow ever.
- Retail demand wavers as Open Interest and funding rates signal a bearish shift in sentiment.

Solana (SOL) marks the third consecutive week of losses, dropping over 13% so far this week. The two-week-old Solana spot Exchange Traded Funds (ETFs) in the US have recorded the lowest net inflows ever, suggesting softer institutional demand. Furthermore, the derivatives market sentiment suffers with the broader market correction, resulting in reduced risk exposure to Solana.
The technical outlook for Solana remains grim as Solana bears aim for the $125 low from June.
Demand wavers for Solana as market volatility spikes
Solana loses ground and investors’ confidence as the broader cryptocurrency market suffers from Bitcoin’s (BTC) slip below $100,000. Sosovalue data shows that the US Solana spot ETFs logged $1.49 million net inflow on Thursday, mainly driven by the Bitwise Solana staking ETF. This marks the lowest inflow since the inception of Solana ETFs, reflecting reduced demand from institutional investors and limiting risk exposure as market conditions fluctuate.
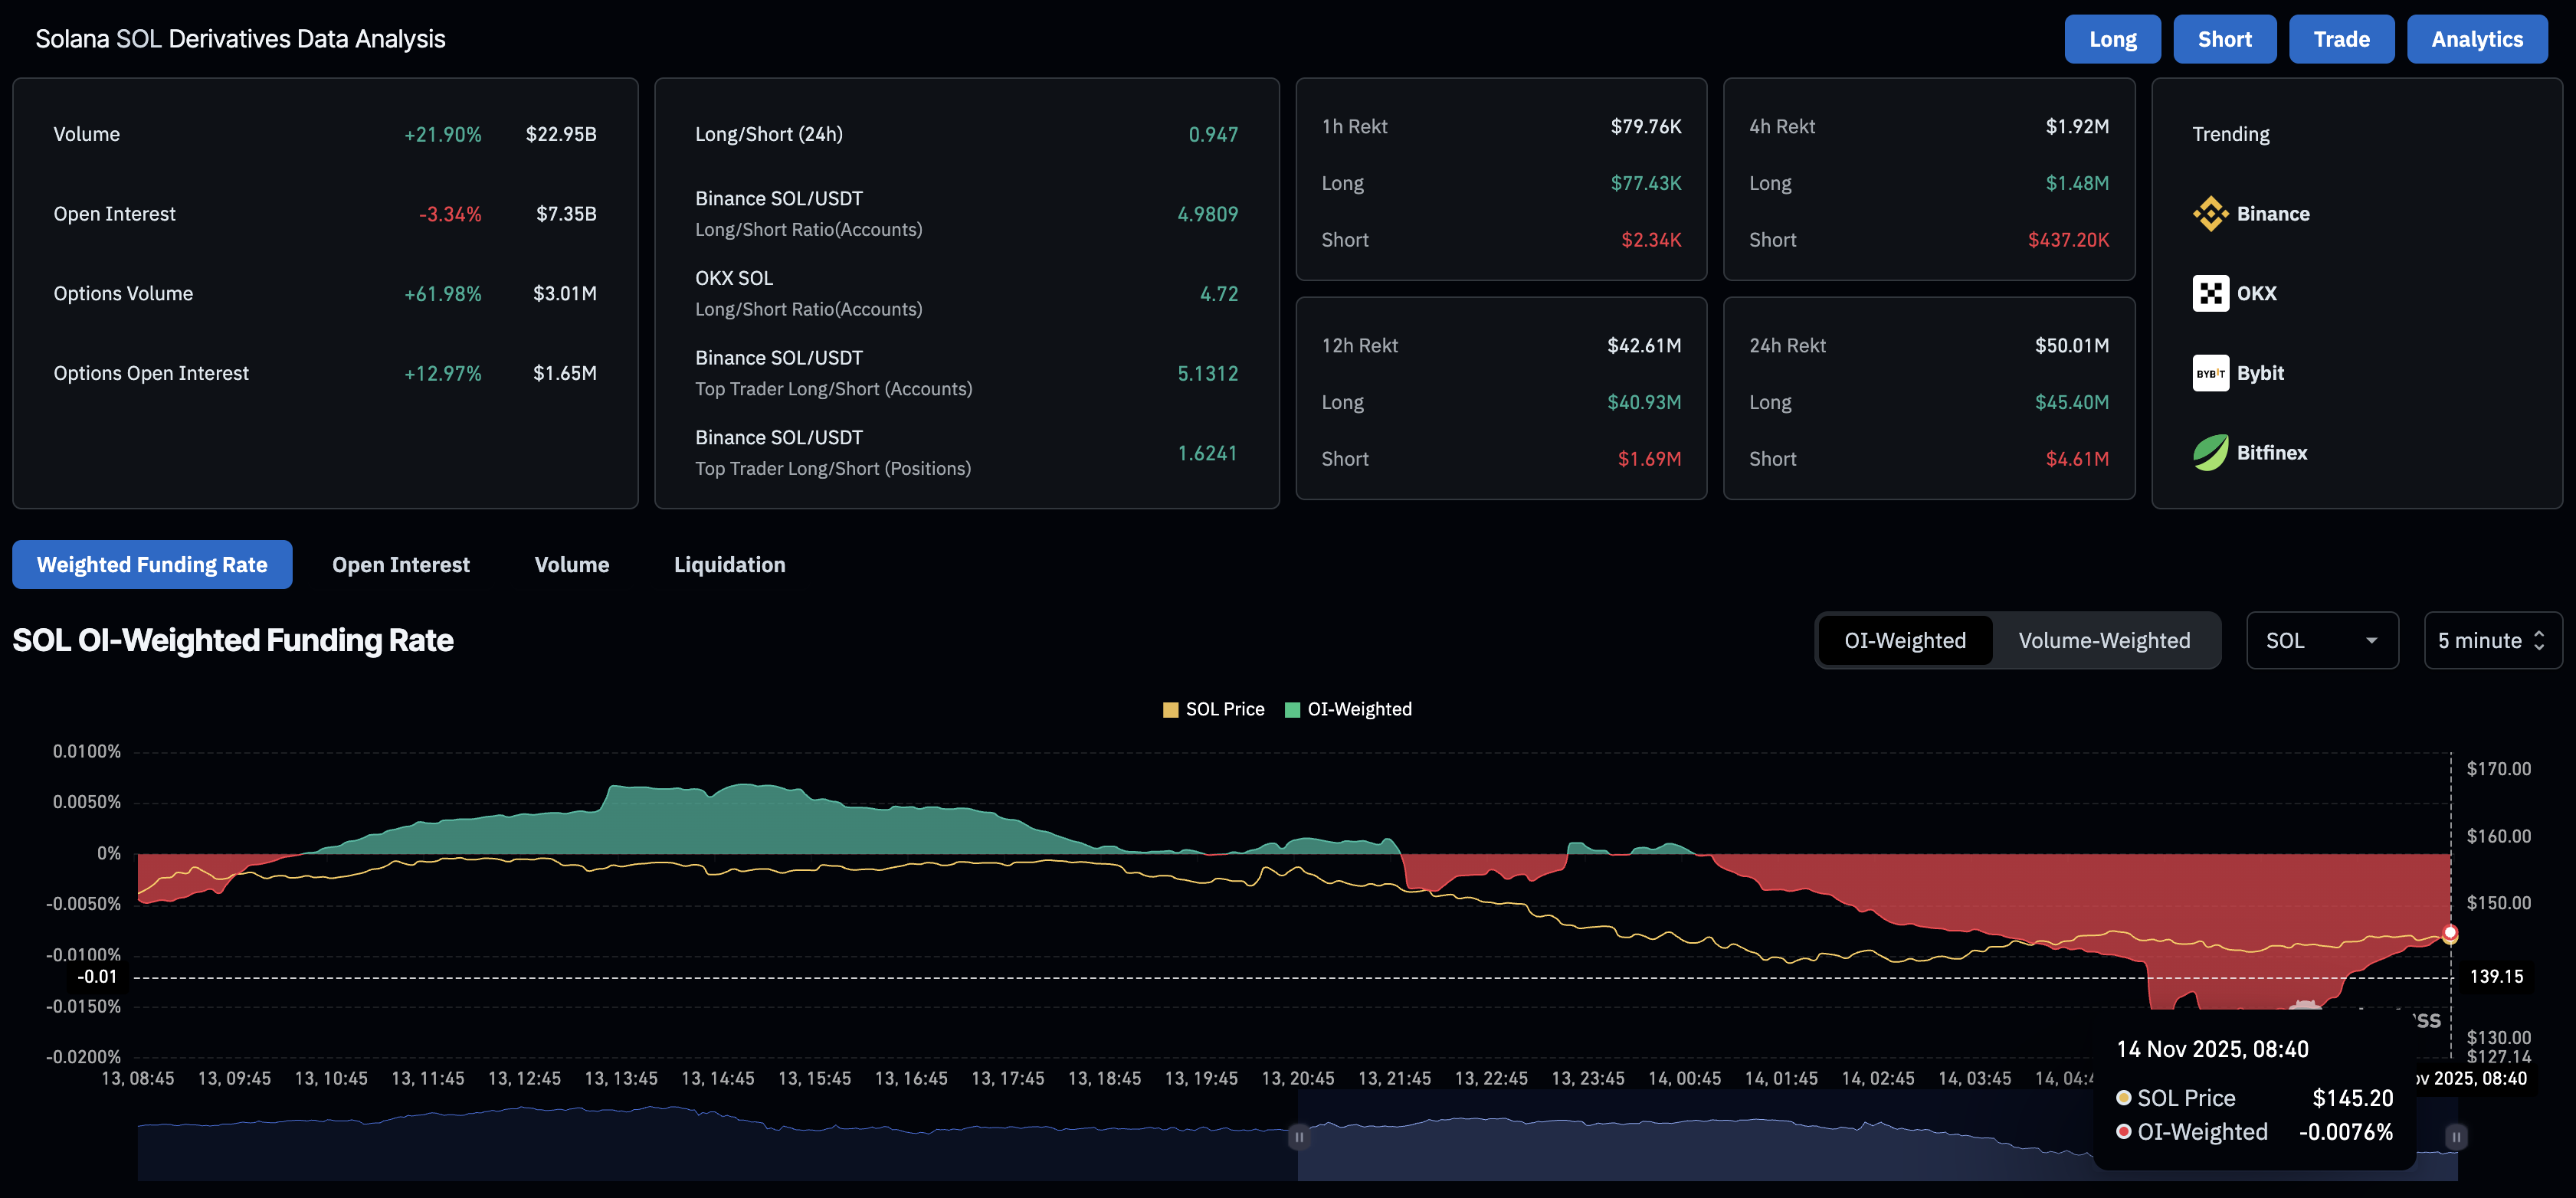
A similar trend is visible in the derivatives market as sentiment shifts bearish, with traders reducing capital allocated to Solana futures. CoinGlass data shows that the SOL futures Open Interest (OI) – notional value of outstanding SOL futures contracts – is down 3.34% in the last 24 hours to $7.35 billion. This indicates that traders are either closing long positions or reducing leverage.
Corroborating the bearish shift, the OI-weighted funding rate has shifted to a negative level of -0.0076% from near-neutral levels earlier in the day, indicating that traders are willing to hold short positions and anticipate an extended correction.
If Solana derivatives continue to bleed capital or ETFs record their first net daily outflow, the recovery would be a tough battle for bulls.
Technical outlook: Will Solana extend the decline to $100?
Solana edges lower for the fourth consecutive day this week, breaking below the $150 psychological level. At the time of writing, SOL is down nearly 2% so far on Friday, aiming for the $126 low from June 22. If SOL breaks below $126, it could test the $100 psychological support, followed by the $95 low from April 7.
The short-term dominance of bearish candles fuels the declining trend in the 50-day Exponential Moving Average (EMA), which converges with the 200-day EMA, risking a Death Cross pattern. If the pattern materializes, it could flash a sell signal, cementing that the short-term bearish trend has outpaced the longer-term trend.
Meanwhile, the trend momentum shifts bearish on the daily timeframe as the Moving Average Convergence Divergence (MACD) fails to cross above the signal line, extending the downward trend.
At the same time, the Relative Strength Index (RSI) dips to 31 on the same chart, oscillating towards the oversold zone, which reflects a fresh surge in selling pressure. However, as RSI hovers on the oversold boundary while SOL price makes a fresh low, this generates a bullish RSI divergence pattern signaling a potential bounce back.
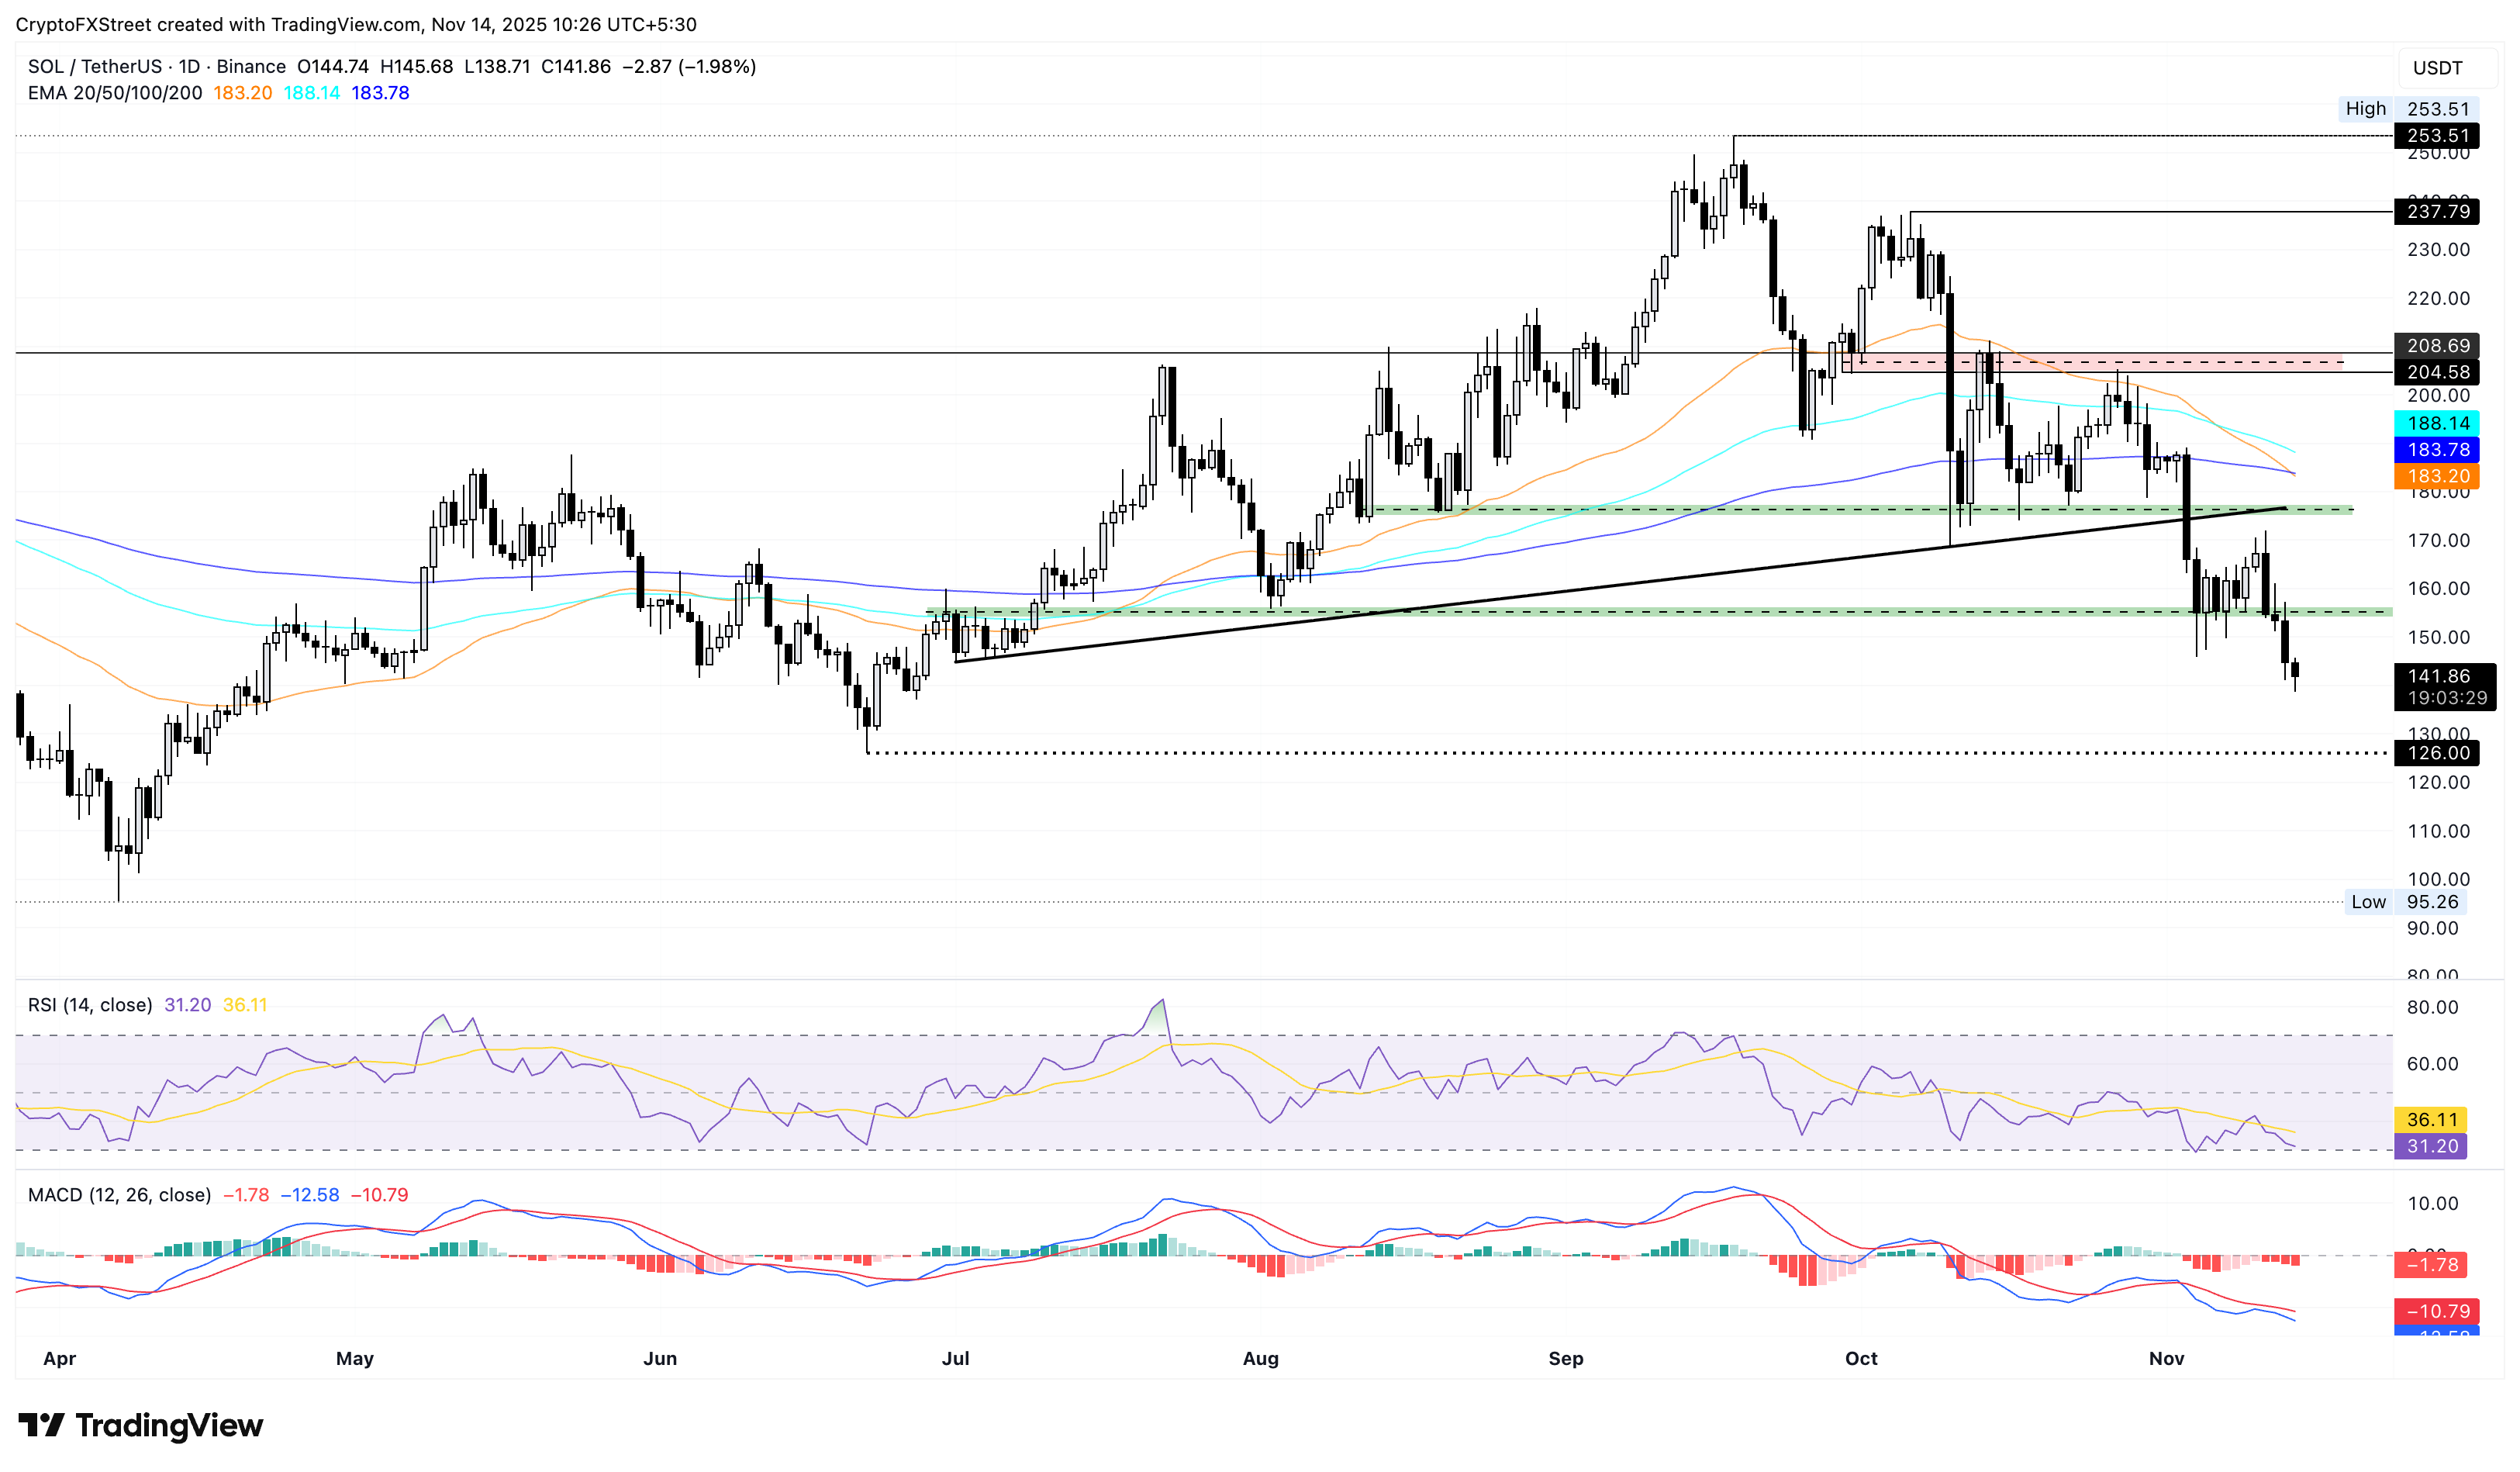
If SOL resurfaces above the $155 demand-turned-supply zone, it could approach the $175 resistance.
Author

Vishal Dixit
FXStreet
Vishal Dixit holds a B.Sc. in Chemistry from Wilson College but found his true calling in the world of crypto.


