Solana Price Forecast: SOL falling wedge pattern projects 22% breakout
- Solana edges lower as supply overwhelms demand across the cryptocurrency market.
- A falling wedge pattern on the daily chart hints at a potential 22% breakout to $200.
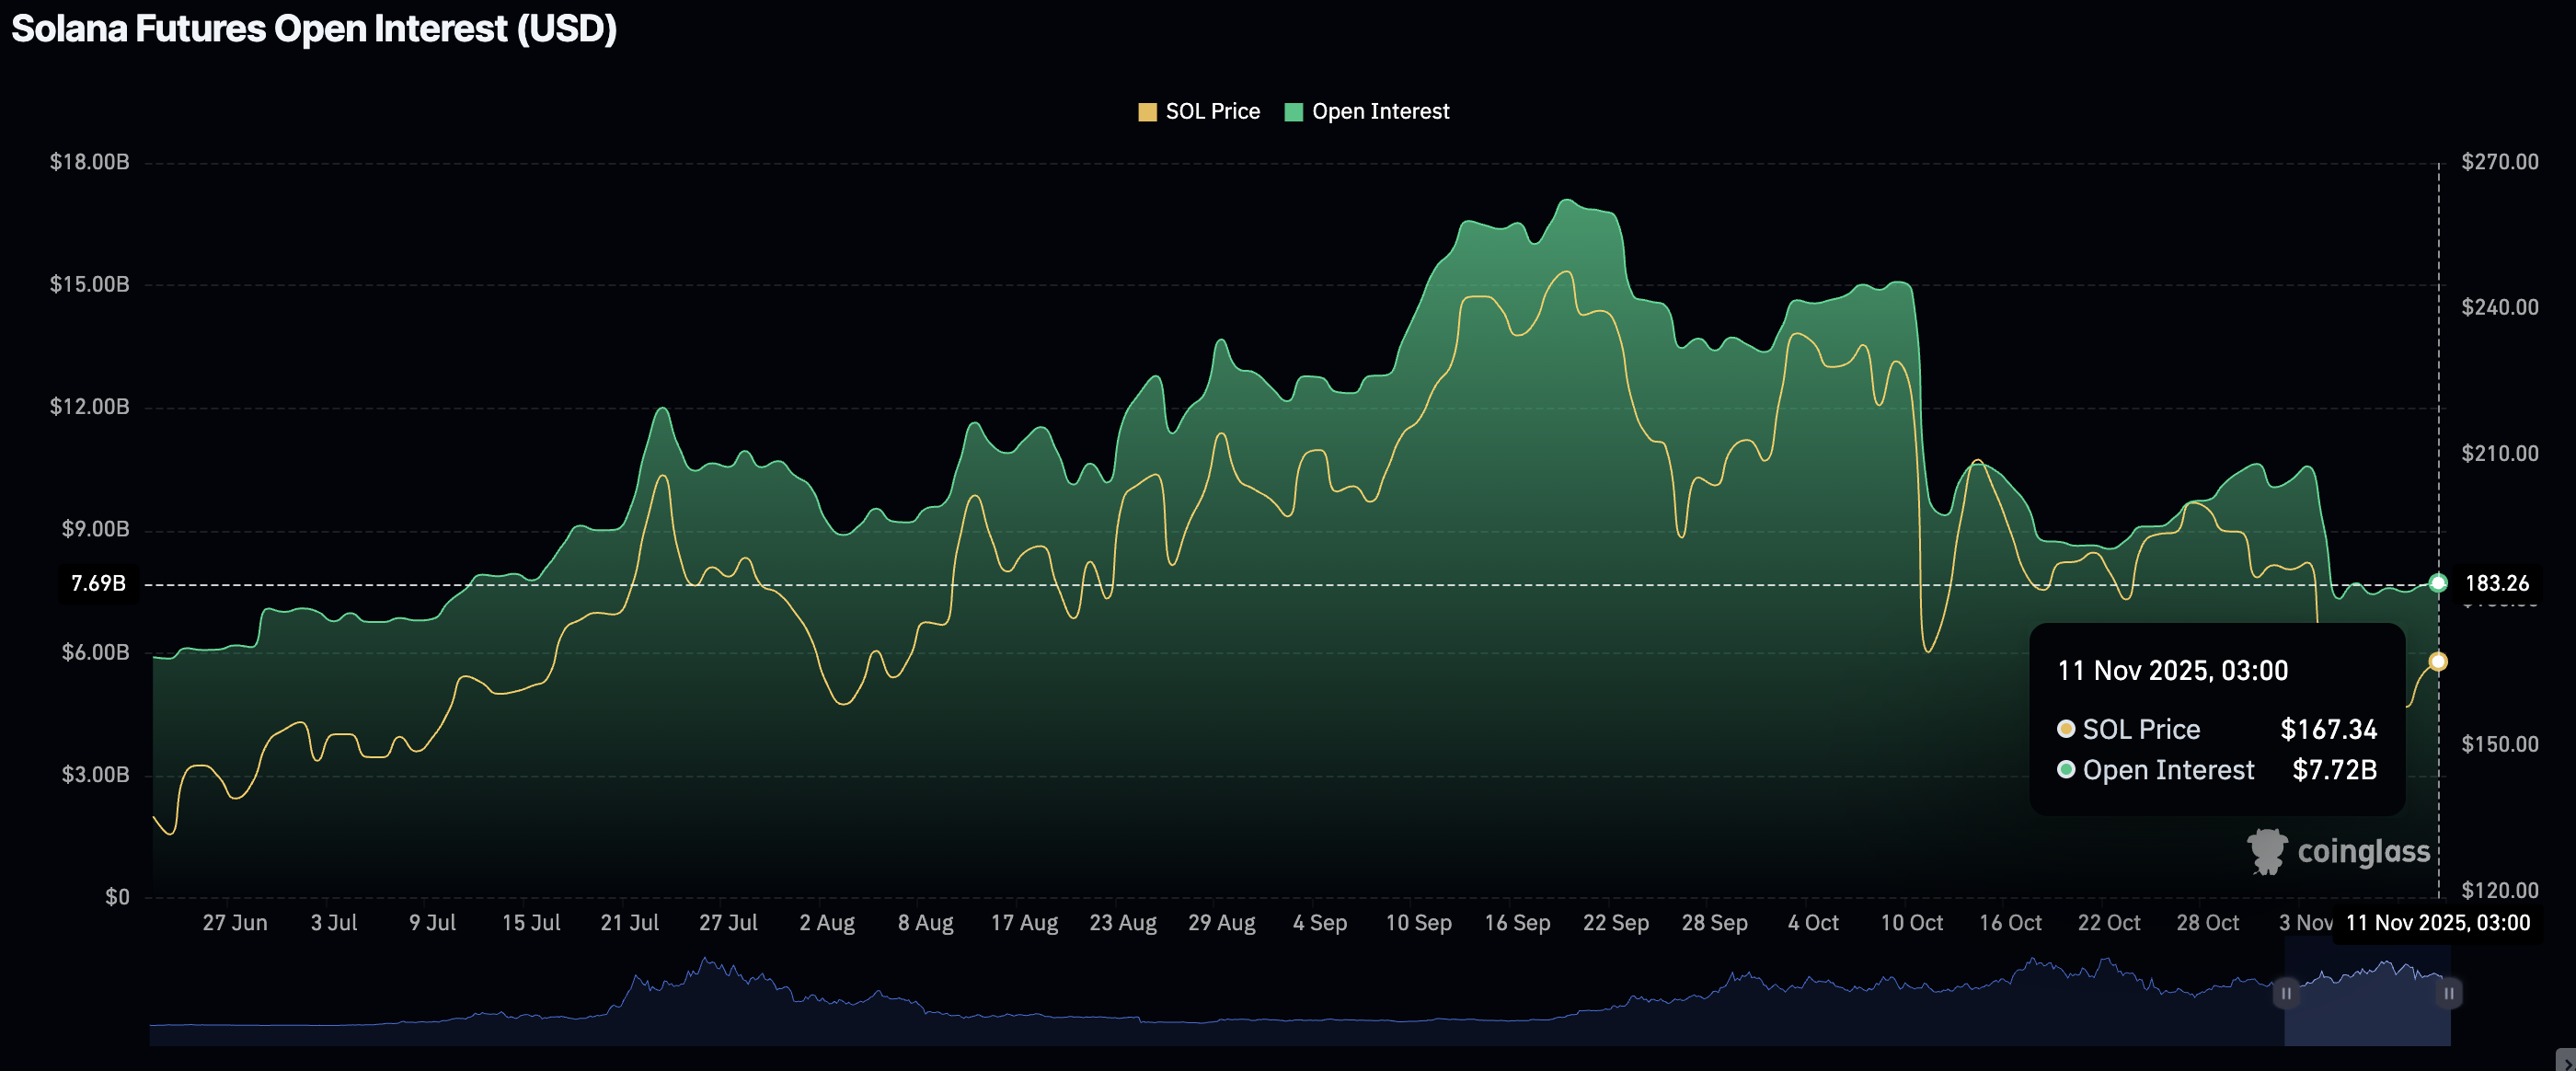
- SOL Open Interest remains largely muted since the October 10 leverage flush, signaling low speculative build-up.

Solana (SOL) is trading around $164 at the time of writing on Tuesday, reflecting a lethargic sentiment spreading across the cryptocurrency market after the previous day’s bullish momentum.
Solana derivatives signal cooling bullish sentiment
Solana’s derivatives market has not recovered since the October 10 deleveraging event, which liquidated over $19 billion in crypto assets in a single day. According to CoinGlass data, the futures Open Interest (OI) averages $7.72 billion on Tuesday, down from $10 billion on November 1 and $14.83 billion on October 1.
The suppressed OI, representing the national value of outstanding futures contracts, suggests that retail investors have retreated to the sidelines until risk-on sentiment returns.
Traders should watch for a steady recovery in OI to ascertain the short-term bullish outlook. Otherwise, Solana’s recovery potential could remain limited.
Technical outlook: Solana bulls eye short-term breakout
Solana is holding marginally above $164 at the time of writing on Tuesday, as bearish waves build in the broader cryptocurrency market amid possible early profit-taking.
The Relative Strength Index (RSI) holds at 40 on the daily chart, signaling a potential decline. If a downtrend develops targeting oversold territory, the path of least resistance will remain downward, increasing Solana’s odds of falling below $160.
Solana's price is also positioned below key moving averages, including the 200-day Exponential Moving Average (EMA) at $185, the 50-day EMA at $188, and the 100-day EMA at $190, which supports the prevailing negative sentiment.
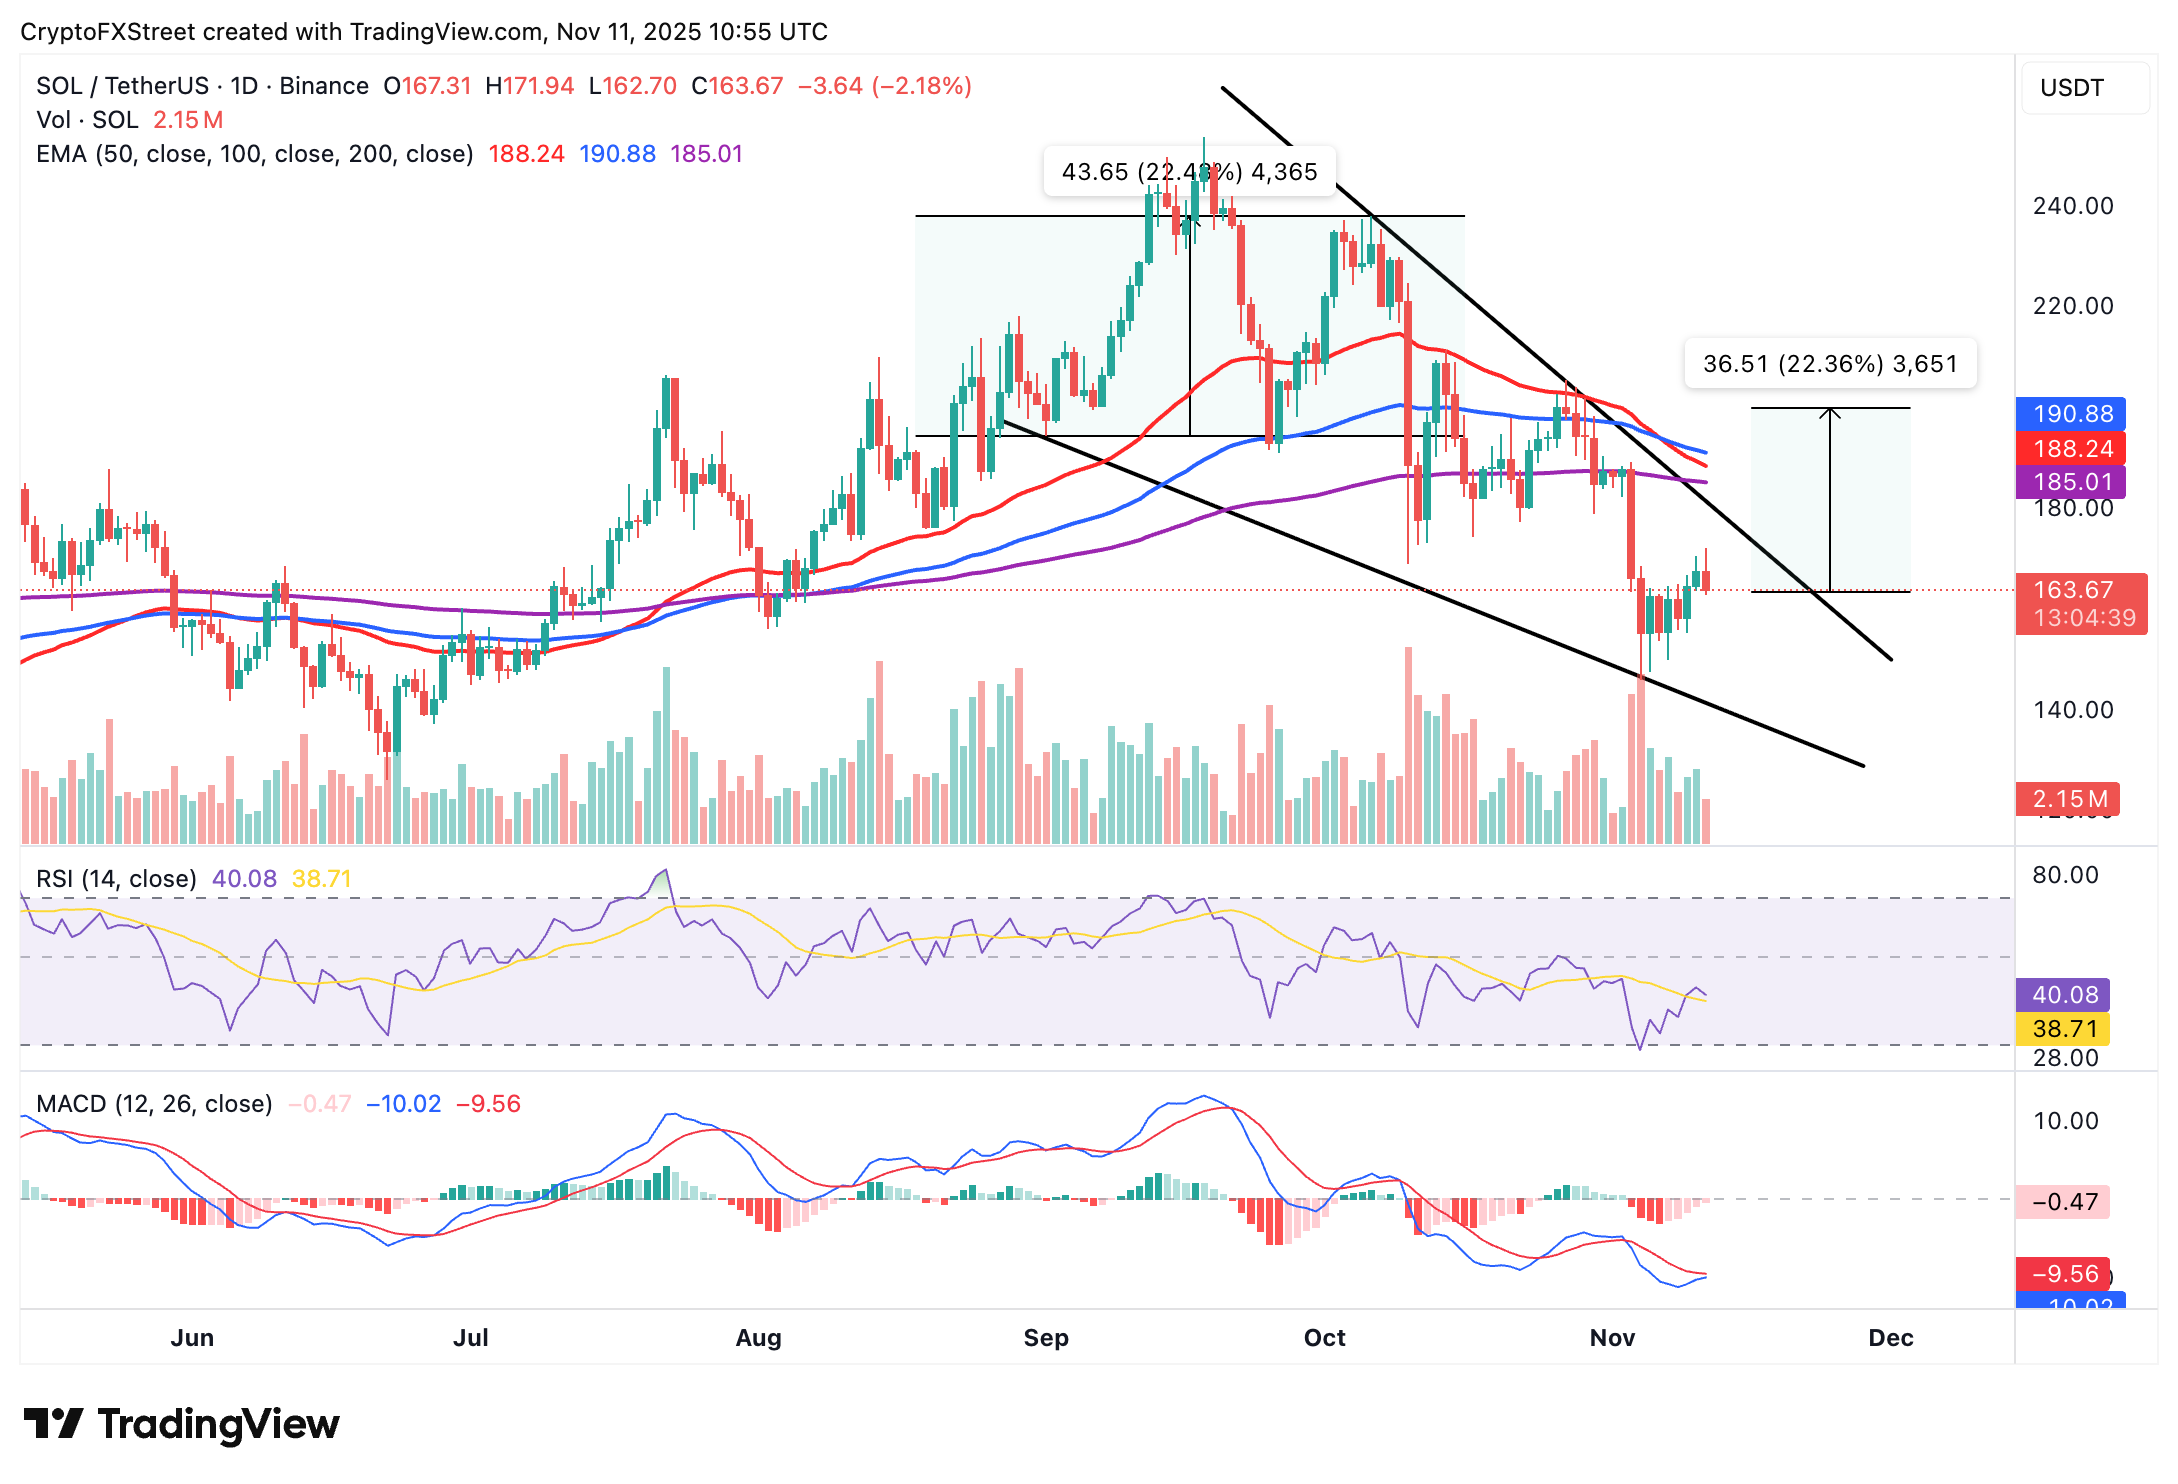
SOL/USDT daily chart
Conversely, the Moving Average Convergence Divergence (MACD) indicator on the same chart is poised to trigger a buy signal. This signal occurs when the blue line crosses and settles above the red signal line, encouraging investors to increase their risk exposure.
A falling wedge pattern is forming on this chart, indicating possible consolidation and accumulation before the next breakout. It is a bullish pattern formed by two downward-sloping trendlines that connect a series of lower highs and lower lows.
A 22% breakout to $200 is estimated if Solana breaks above the upper trendline. The target is equal to the distance between the pattern’s widest points, extrapolating above the breakout position.
Open Interest, funding rate FAQs
Higher Open Interest is associated with higher liquidity and new capital inflow to the market. This is considered the equivalent of increase in efficiency and the ongoing trend continues. When Open Interest decreases, it is considered a sign of liquidation in the market, investors are leaving and the overall demand for an asset is on a decline, fueling a bearish sentiment among investors.
Funding fees bridge the difference between spot prices and prices of futures contracts of an asset by increasing liquidation risks faced by traders. A consistently high and positive funding rate implies there is a bullish sentiment among market participants and there is an expectation of a price hike. A consistently negative funding rate for an asset implies a bearish sentiment, indicating that traders expect the cryptocurrency’s price to fall and a bearish trend reversal is likely to occur.
Author

John Isige
FXStreet
John Isige is a seasoned cryptocurrency journalist and markets analyst committed to delivering high-quality, actionable insights tailored to traders, investors, and crypto enthusiasts. He enjoys deep dives into emerging Web3 tren


