Solana Price Forecast: SOL extends recovery as trading volume surges
- Solana price extends recovery on Monday after rebounding from the ascending trendline support.
- The upcoming Accelerate APAC event on Friday could fuel further optimism regarding the network’s growth outlook.
- Technical indicators suggest potential for further upside, with trading volume surging to levels not seen since mid-January.

Solana (SOL) price extends its recovery, trading above $192 at the time of writing on Monday, after rebounding from the ascending trendline support last week. The recovery is supported by increasing trade volumes, which have climbed to levels last seen in mid-January, and expectations ahead of the upcoming Accelerate Asia Pacific Accreditation Cooperation (APAC) event on Friday, which could highlight key ecosystem developments.
Solana’s Accelerate APAC event in China could add to optimism
Solana started the week on a positive note, extending the weekend recovery and trading above $192 during the early European trading session on Monday. Optimism surrounds the network ahead of the Accelerate Asia Pacific Accreditation Cooperation event starting Friday in China, which is expected to highlight Solana’s growing role in the region’s Decentralized Physical Infrastructure Networks (DePIN) ecosystem.
“The Asia-Pacific market has the fertile ground to promote the development of DePIN. Solana has gathered a group of high-quality DePIN projects”, says Solana’s official tweet post on Monday.
Santiment data indicate that the Solana ecosystem’s trading volume (the aggregate trading volume generated by all exchange applications on the chain) reached $220 million on Saturday, the highest level last seen since mid-January. This volume rise indicates a surge in traders’ interest and liquidity in Solana, boosting its bullish outlook.
 [10-1760942223394-1760942223395.10.58, 20 Oct, 2025].png)
Solana trading volume chart. Source: Santiment
Solana Price Forecast: SOL targets levels above $200
Solana price faced rejection from the 50-day Exponential Moving Average (EMA) at $206.09 on Tuesday and declined 13% by Friday, retesting the ascending trendline. SOL rebounded 3% in the next two days. At the time of writing on Monday, it continues to recover, trading above $192.
If SOL continues its recovery, it could target the 50-day EMA at $206.09.
The Relative Strength Index (RSI) on the daily chart reads 44, pointing upward toward the neutral level of 50, indicating early signs of fading bearish momentum. For the recovery to be sustained, the RSI must move above the neutral level.
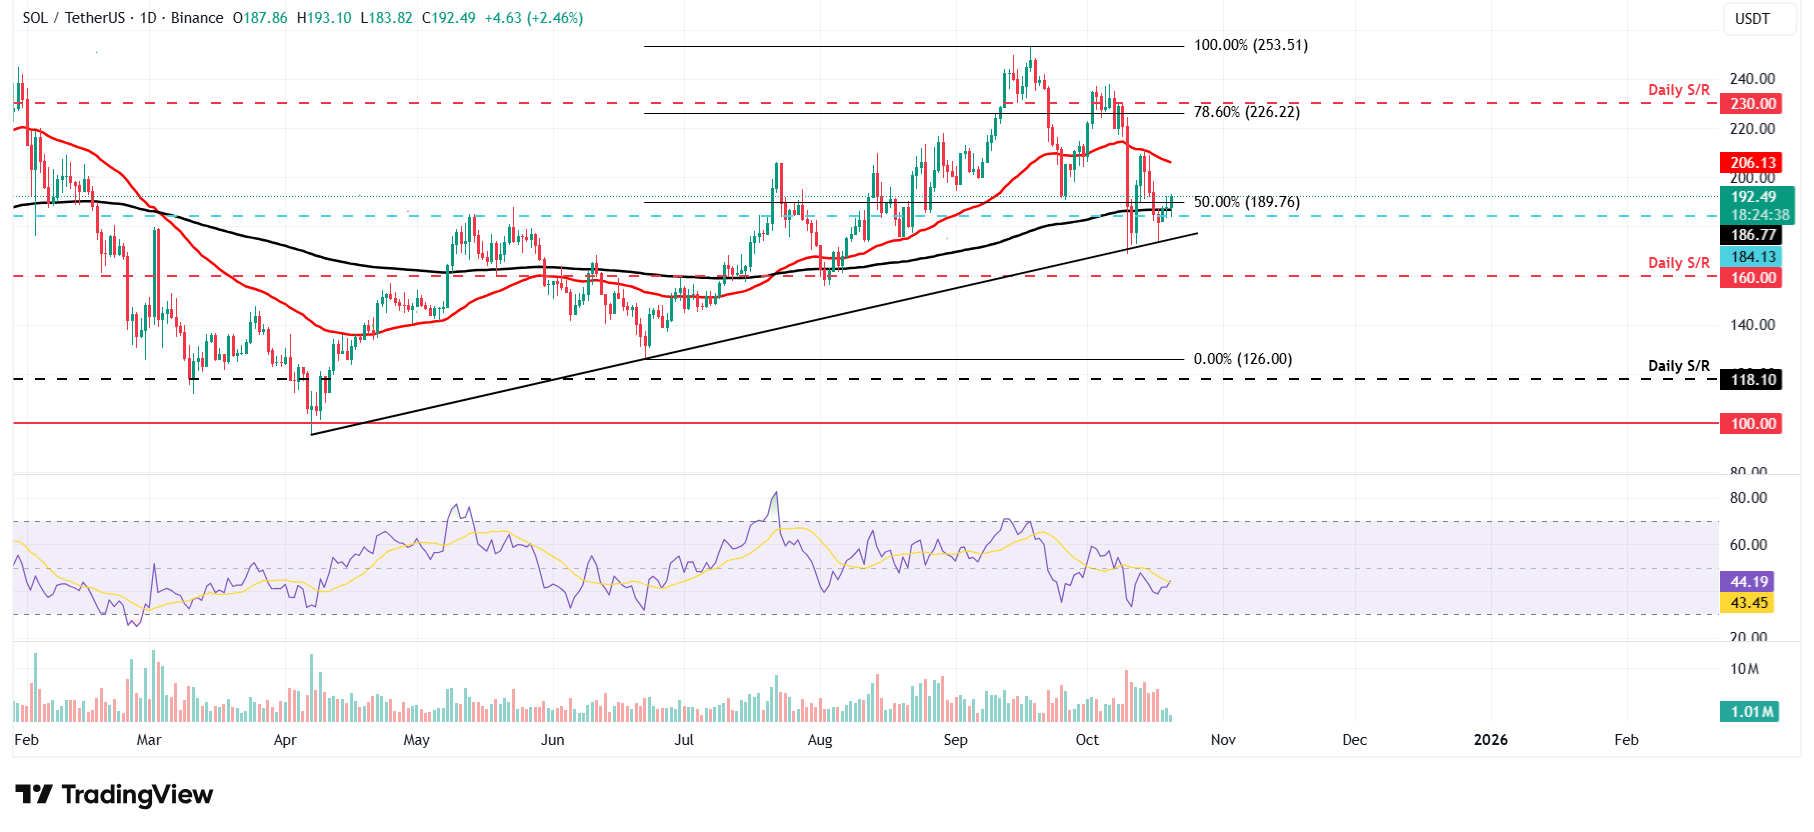
SOL/USDT daily chart
On the other hand, if SOL faces a correction, it could extend the decline toward the ascending trendline at around $186.
Author

Manish Chhetri
FXStreet
Manish Chhetri is a crypto specialist with over four years of experience in the cryptocurrency industry.


