Solana Price Forecast: SOL bulls gain momentum as Open Interest reaches new all-time high
- Solana price extends its gains on Friday after rallying nearly 15% so far this week.
- Derivatives data shows that SOL Open Interest reaches a record high of $9.71 billion, signaling investors’ confidence.
- The technical outlook suggests a continuation of the rally, targeting levels above $200.

Solana (SOL) price is extending its gains, trading above $183 on Friday after rallying nearly 15% so far this week. This ongoing rally gains further momentum as SOL Open Interest (OI) reaches a record high of $9.71 billion, reflecting rising investor confidence. The technical outlook supports this bullish thesis, with SOL bulls aiming for levels above $200.
Solana’s open interest hits a new all-time high of $9.71 billion
Coinglass’ data shows that the futures’ OI in SOL at exchanges rises to a new all-time high of $9.71 billion on Friday from $7.78 billion at the start of this week on Monday. An increasing OI represents new or additional money entering the market and new buying, which could fuel the current Solana price rally.
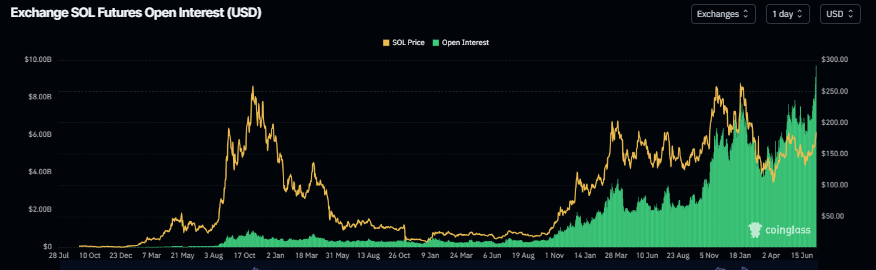
Solana Open Interest chart. Source: Coinglass
Additionally, data from crypto intelligence tracker DefiLlama shows that Solana’s Total Value Locked (TVL) has been constantly rising since the end of June and has reached $9.87 billion on Friday, levels not seen since early February. This increase in TVL indicates growing activity and interest within SOL’s ecosystem, suggesting that more users are depositing or utilizing assets within SOL-based protocols.
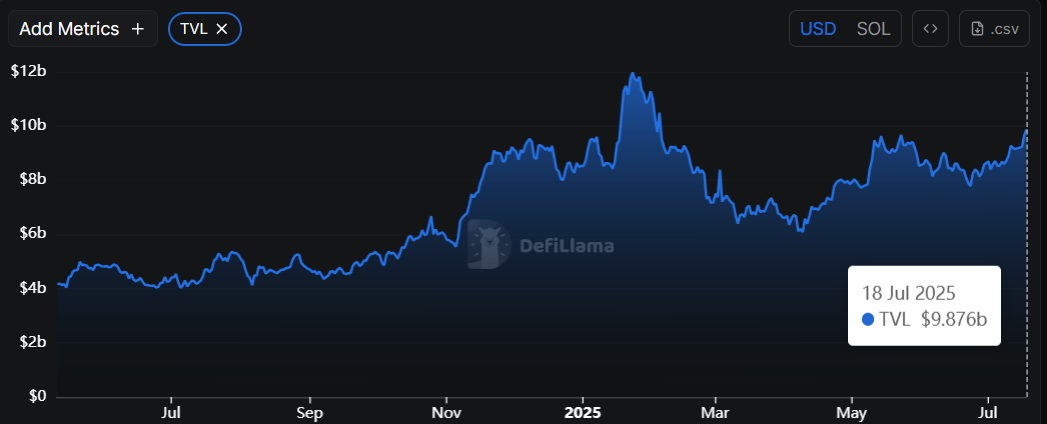
SOL TVL chart. Source: DefiLlama
Solana Price Forecast: SOL bulls eyeing levels above $200
Solana price broke above the daily resistance level of $160 on Sunday, rallying 9% until Thursday. At the time of writing on Friday, it continues to trade higher, approaching its next daily resistance at $184.13.
If SOL breaks and closes above this level, it could extend the rally toward the February 14 high of $205.34.
The Relative Strength Index (RSI) indicator reads 73 on the daily chart, flashing overbought conditions and indicating strong bullish momentum. Additionally, the Moving Average Convergence Divergence (MACD) bullish crossover remains in effect after issuing a buy signal at the end of June. It also shows rising green histogram bars above its neutral zero line, suggesting that bullish momentum is gaining traction.
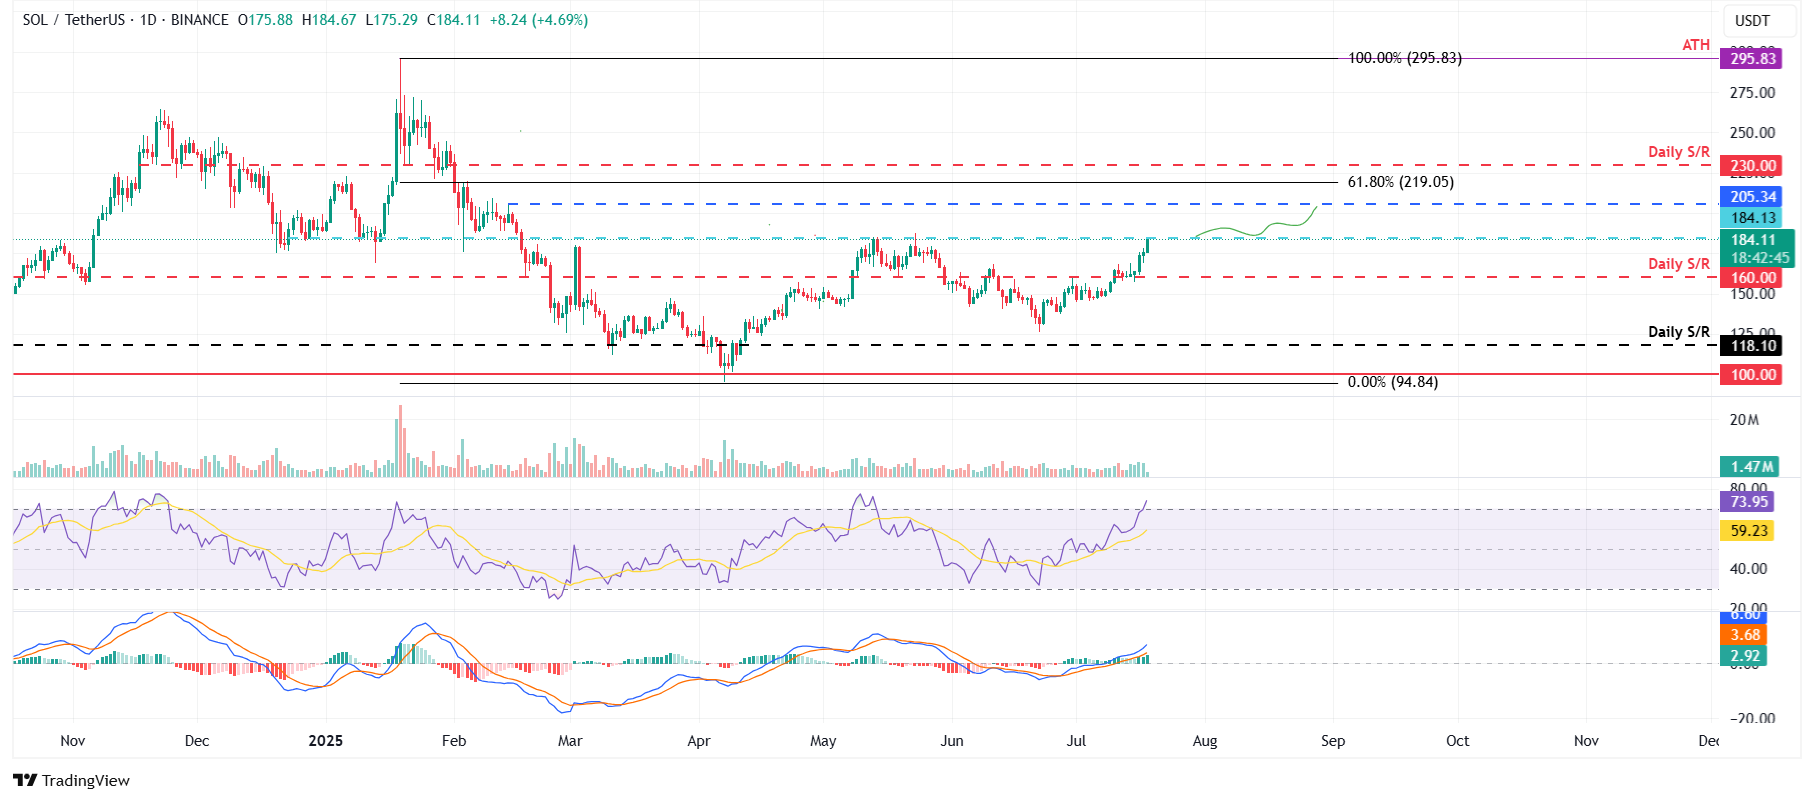
SOL/USDT daily chart
However, if SOL faces a correction, it could extend the decline to find support around its daily level at $160.
Author

Manish Chhetri
FXStreet
Manish Chhetri is a crypto specialist with over four years of experience in the cryptocurrency industry.


