Top 3 Price Prediction: Bitcoin, Ethereum, Ripple – BTC nears all-time high, ETH eyes $4,000, XRP sets new record
- Bitcoin price trades above $120,000 on Friday, inching closer to its all-time high of $123,218.
- Ethereum rallies over 20% this week, pushing above $3,500 as it eyes the $4,000 milestone.
- Ripple's XRP hits a new all-time high of $3.66, with momentum hinting at further rally.

Bitcoin (BTC) price is trading above $120,000 on Friday, inching closer to its all-time high of $123,218. Ethereum (ETH) price has surged by over 20% so far this week, with bulls aiming for the $4,000 level next. Ripple (XRP) has taken center stage, reaching a new record high of $3.66 on Friday, signaling renewed demand and optimism across the market.
Bitcoin is inching toward its all-time high
Bitcoin price dipped, reaching a low of $115,736 on Tuesday after hitting a new all-time high of $123,218 the previous day. BTC recovered from this Tuesday’s dip over the next two days and, at the time of writing on Friday, trades above $120,000.
If BTC closes above the $120,000 mark on a daily basis, it could extend the recovery toward the fresh all-time high at $123,218 and beyond.
The Relative Strength Index (RSI) indicator reads 71, rebounding on Tuesday and pointing upward, indicating strong bullish momentum. The Moving Average Convergence Divergence (MACD) exhibited a bullish crossover at the end of June that still holds. The rising green histogram bars above its neutral zero line suggest that bullish momentum is gaining traction.
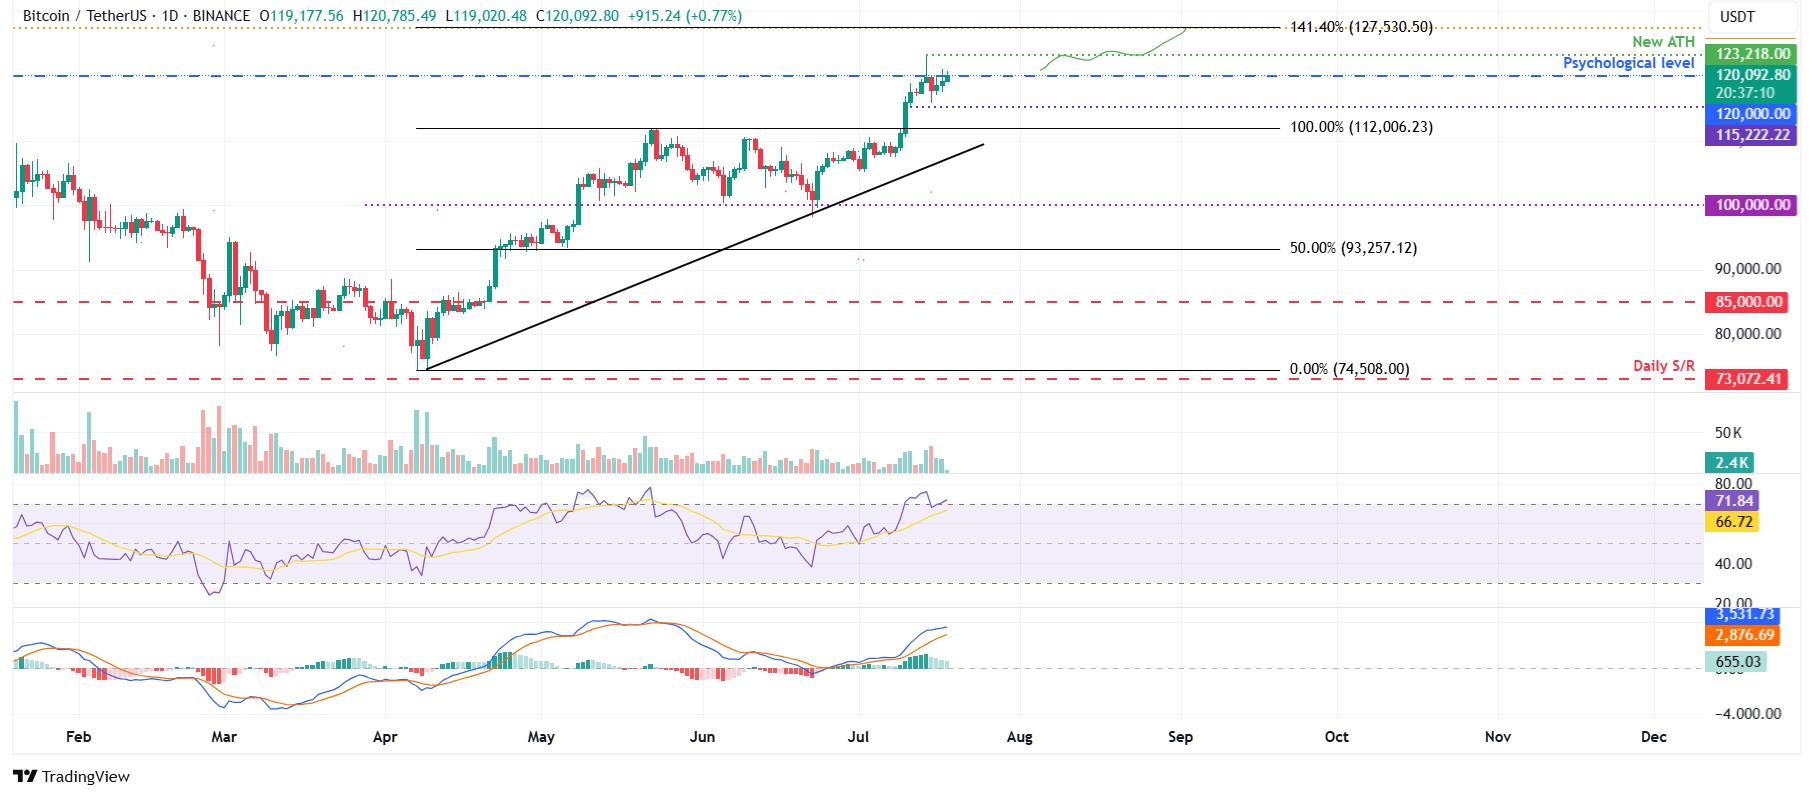
BTC/USDT daily chart
On the contrary, if BTC faces a correction, it could extend the decline to find support around its Tuesday’s low of $115,736.
Ethereum bulls take control, aim for $4,000
Ethereum price closed above the psychological level of $3,000 on Tuesday and rallied by 10.8% on Thursday. At the time of writing on Friday, it continues to trade higher toward its daily resistance at $3,730.
If ETH closes above the daily resistance at $3,730, it could extend the rally toward its next key psychological level at $4,000.
The RSI on the daily chart reads 85, above its overbought level of 70, indicating strong bullish momentum. Meanwhile, the MACD indicator displayed a bullish crossover in early July that still holds. The rising green histogram bars above its neutral zero line suggest that bullish momentum is gaining traction.
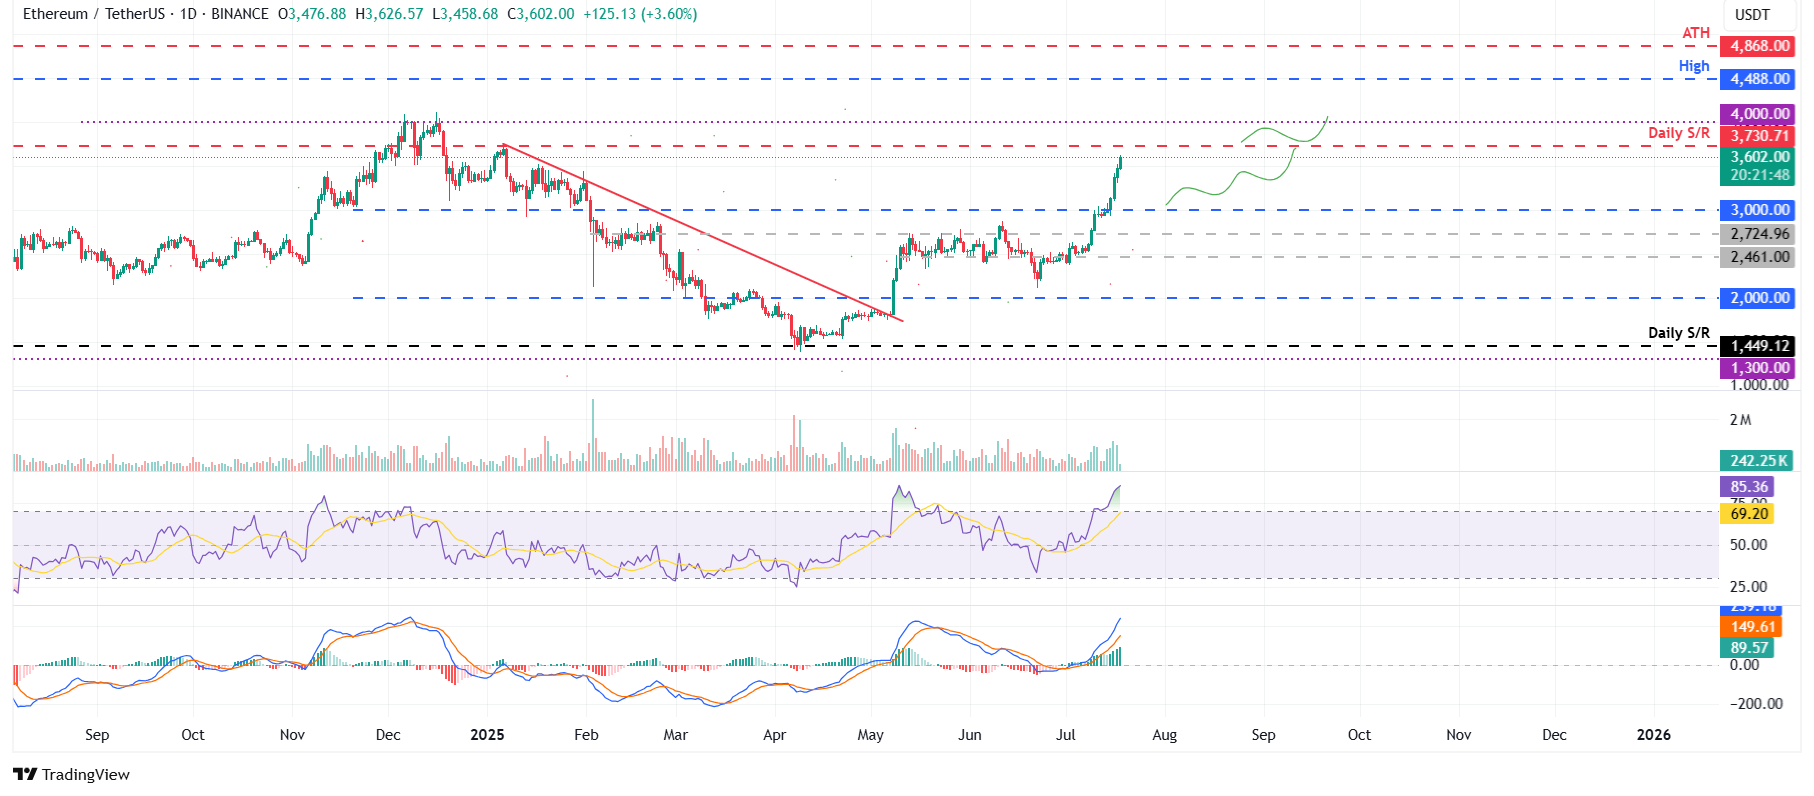
ETH/USDT daily chart
However, if ETH faces a pullback, it could extend the decline to find support around its key level at $3,000.
XRP reaches new all-time high at $3.66
XRP price closed above the key psychological level of $3 on Wednesday and rallied 14.60% the next day. At the time of writing on Friday, it continues to trade higher, reaching a new all-time high of $3.66.
If XRP continues its upward trend, it could extend the rally toward its 141.40% Fibonacci extension level at $4.13, drawn from the January high of $3.40 to the April low of $1.61.
However, the RSI indicator on the daily chart reads 89, indicating an extreme overbought condition, which traders should be cautious of. Meanwhile, like Ethereum, the MACD indicator suggests further gains for XRP ahead.
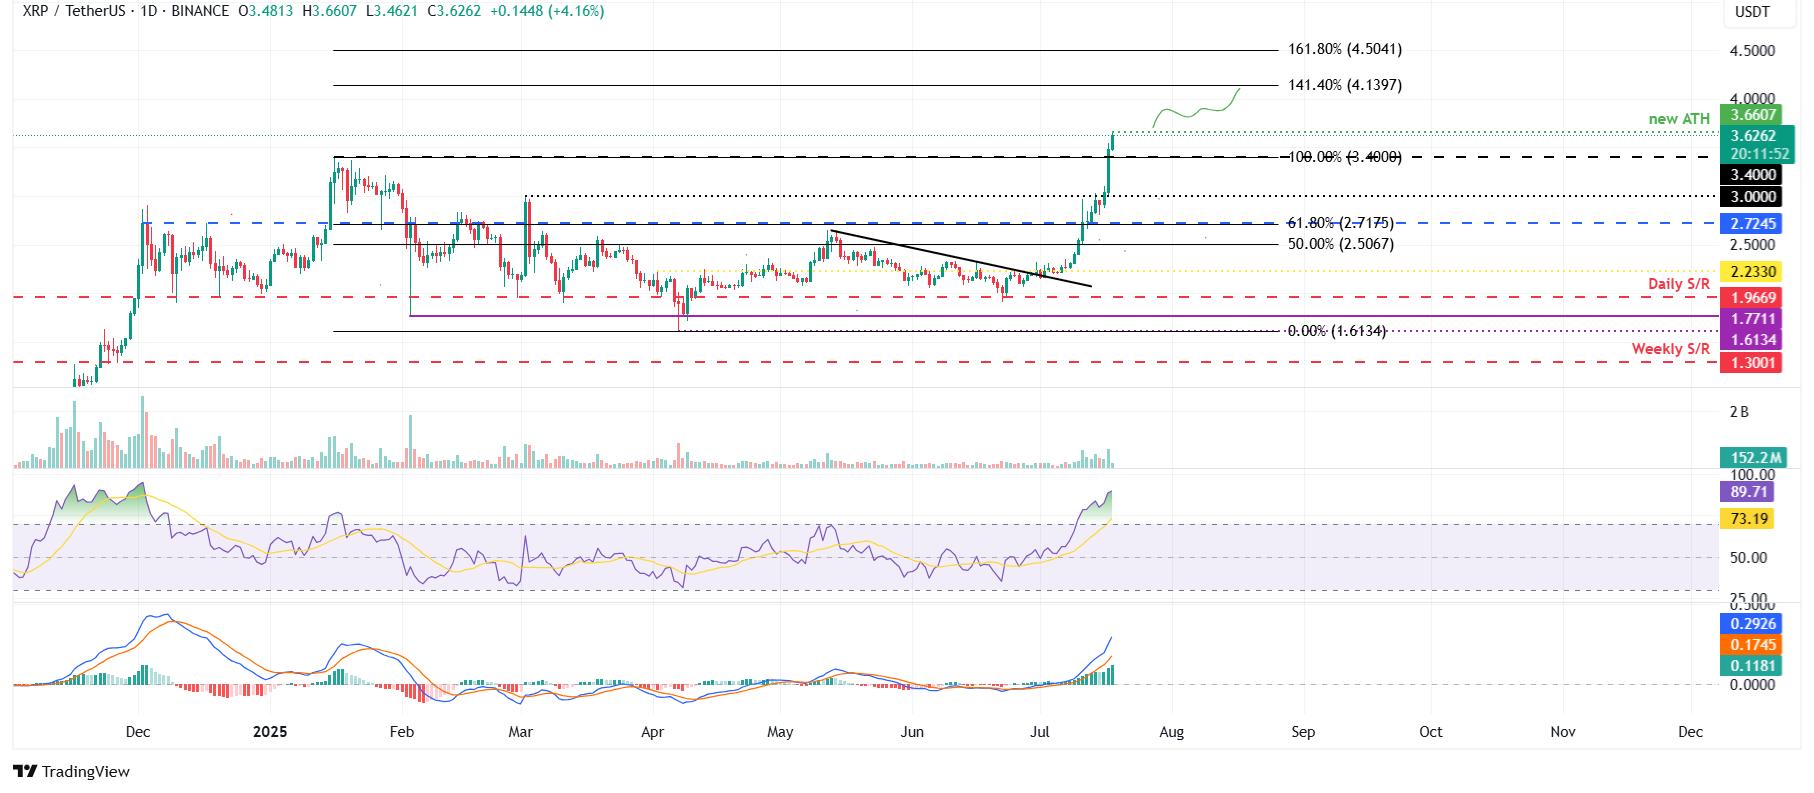
XRP/USDT daily chart
On the other hand, if XRP faces a correction, it could extend the decline to find support around its daily level at $3.40.
Cryptocurrency metrics FAQs
The developer or creator of each cryptocurrency decides on the total number of tokens that can be minted or issued. Only a certain number of these assets can be minted by mining, staking or other mechanisms. This is defined by the algorithm of the underlying blockchain technology. On the other hand, circulating supply can also be decreased via actions such as burning tokens, or mistakenly sending assets to addresses of other incompatible blockchains.
Market capitalization is the result of multiplying the circulating supply of a certain asset by the asset’s current market value.
Trading volume refers to the total number of tokens for a specific asset that has been transacted or exchanged between buyers and sellers within set trading hours, for example, 24 hours. It is used to gauge market sentiment, this metric combines all volumes on centralized exchanges and decentralized exchanges. Increasing trading volume often denotes the demand for a certain asset as more people are buying and selling the cryptocurrency.
Funding rates are a concept designed to encourage traders to take positions and ensure perpetual contract prices match spot markets. It defines a mechanism by exchanges to ensure that future prices and index prices periodic payments regularly converge. When the funding rate is positive, the price of the perpetual contract is higher than the mark price. This means traders who are bullish and have opened long positions pay traders who are in short positions. On the other hand, a negative funding rate means perpetual prices are below the mark price, and hence traders with short positions pay traders who have opened long positions.
Author

Manish Chhetri
FXStreet
Manish Chhetri is a crypto specialist with over four years of experience in the cryptocurrency industry.


