|

Solana Price Forecast: On the verge of 18% rally

  • Solana price extends gains on Wednesday after rebounding at the one-month rising trendline around $164.50 on Tuesday.
  • Investors could accumulate SOL at support levels extending between $160.02 and $144.48.
  • A daily candlestick close below $137.58 would invalidate the bullish thesis.

Solana (SOL) price increases for a third consecutive day on Wednesday and looks set for a further 18% rally, technical indicators show, offering sidelined traders a buying opportunity before the token extends gains

Solana price looks promising

Solana price holds above the $160 level and seems to edge higher, but sidelines bulls could still have a buying opportunity at the following levels:

  1. The daily support level from the April 23 top at $160.02.
  2. At the 61.8% Fibonacci retracement level at $144.48.

Assuming the Solana price bounces off at $160.02, it could rally 18% to its previous high of $188.84 on May 21. Supporting the aforementioned bounce are the Relative Strength Index (RSI) and Awesome Oscillator (AO) indicators, which found support at their respective mean values of 50 and 0 and signaling that bullish momentum is in control.

In case of an aggressive bullish outlook, SOL could rally by an additional 7% to $202.45 and retest the daily close of March 31.
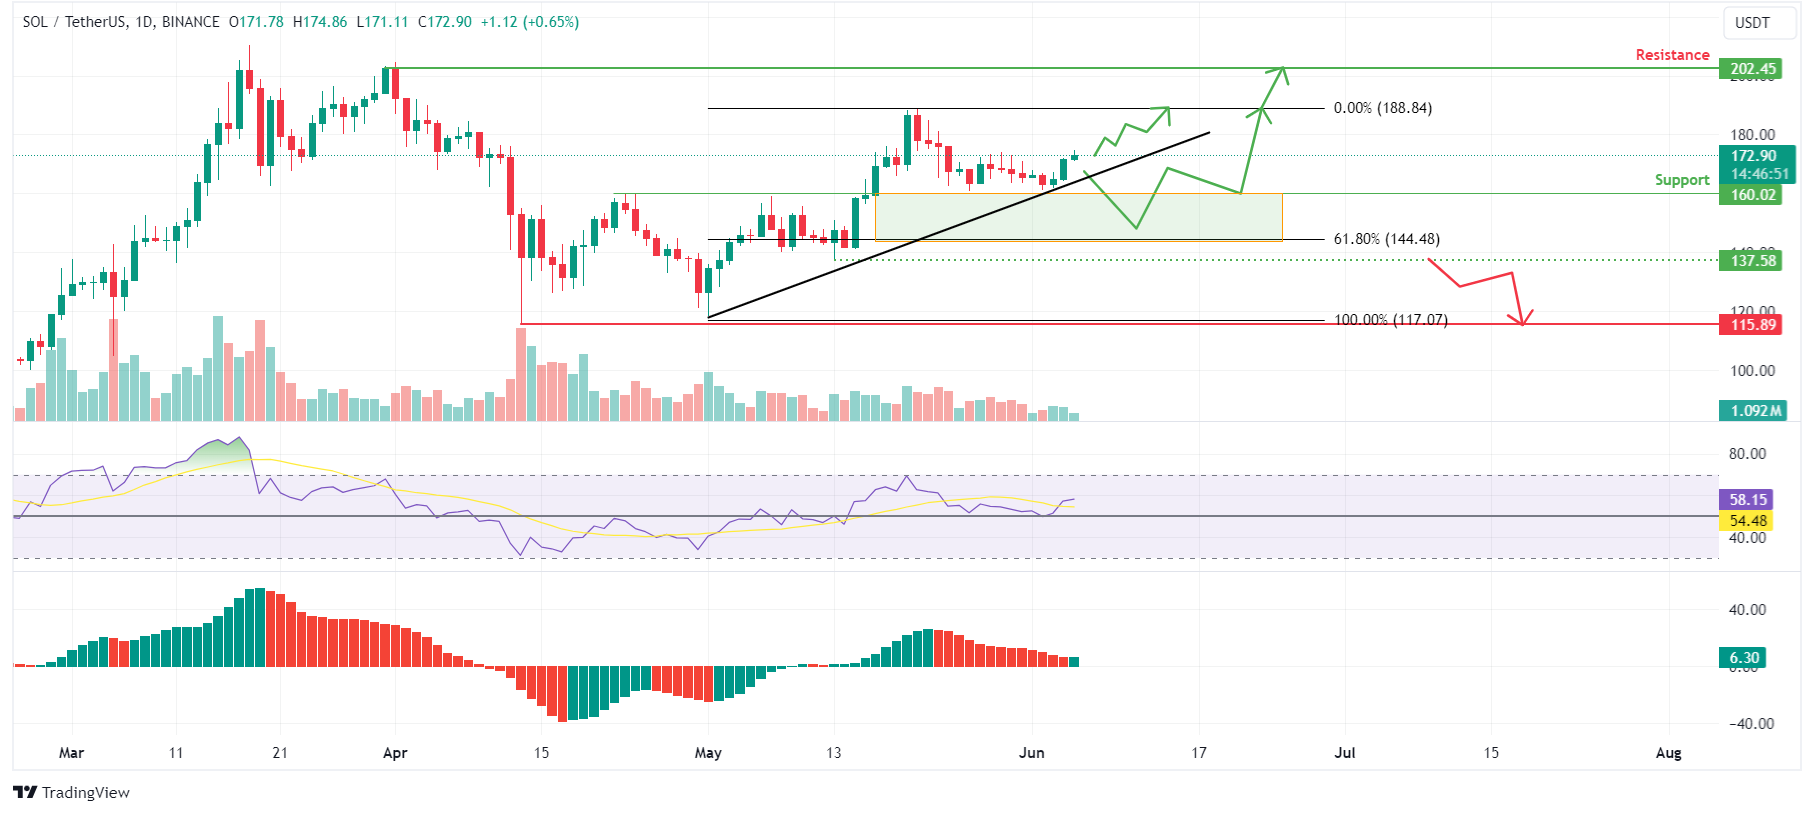
SOL/USDT 1-day chart

SOL/USDT 1-day chart

However, if the SOL daily candlestick closes below the May 13 low at $137.58 and forms a lower low on the daily time frame, it could lead to a change in market structure favoring the bears. This change could invalidate the bullish thesis, leading to a 16% crash to the previous daily support level of $115.89 from April 13.

Author

Manish Chhetri

Manish Chhetri is a crypto specialist with over four years of experience in the cryptocurrency industry.


More from Manish Chhetri
Share:

Editor's Picks

Ripple and Stellar outlook: Stay under pressure as cautious sentiment builds

Ripple and Stellar remain under pressure, with both altcoins correcting slightly. XRP nears the key $1.00 support zone on Thursday, while XLM trades below critical technical levels. Mixed derivatives and on-chain metrics suggest cautious sentiment, leaving both tokens vulnerable to further downside while offering hope for a potential recovery.

Crypto Market Overview: Bitcoin loses softer CPI gains – Virtuals Protocol, OKB rise

Bitcoin is trading around $63,000 after three consecutive days of losses. The US Consumer Price Index for July met market expectations of 3.4% the previous day, resulting in a mild rebound in BTC above $64,000, but it was lost later in the day, leading to a bearish close. Virtuals Protocol and OKB have emerged as top performers over the last 24 hours.

Bitcoin faces thin liquidity and missing demand amid seller stress — Glassnode

Bitcoin is showing signs of growing market exhaustion, with weakening liquidity and subdued demand leaving the market vulnerable to a sharp move, according to a Glassnode report on Wednesday. The firm stated that Bitcoin is trading between two important cost-basis levels as market activity has fallen to its lowest point since 2019.

Bitcoin shows early signs of bottom despite lingering market stress
Bitcoin (BTC) is showing several signs of a potential market bottom as multiple indicators show improving market conditions, according to CryptoQuant analysts. CryptoQuant data revealed that Bitcoin has produced a second early bull signal, a pattern that has historically appeared closer to market bottoms.
Bitcoin: Can bulls weather the market uncertainty?
Bitcoin (BTC) remains resilient, trading above $65,000 on Friday, with bulls defending key support despite cautious market sentiment. US-listed spot Bitcoin Exchange-Traded Funds (ETFs) showed strong inflows through Thursday, pointing to renewed institutional demand.

