Solana price bound for a 72% bullish breakout
- Solana price forms a classic squeeze against $58.84 top level.
- SOL price will see a bullish breakout that will hit the red descending trend line.
- Depending on the motivation and deflation of tail risks, expect a break above the trend line toward $95.31.

Solana (SOL) price is on the cusp of piercing through the plateau, which has kept price action muted to the downside since last week. Once the bullish breakout is behind us, expect SOL price to test the red descending trend line around $78 and, depending on the buy volume behind it, could pierce through that trend line. That break would be the key trigger for investors to get back in behind the price action and watch it quickly spiral higher toward $95.31 with the 55-day Simple Moving Average (SMA) as a cap.
SOL price set to pop 72% as bullish squeeze gets underway
Solana price is on its way to performing a classic bullish squeeze with higher lows and price action getting squashed against the top line at $58.84. Pressure is building, and bears will soon need to forfeit their positions and inadvertently join the buyers to close their short positions. With that move, demand on the buy-side will quadruple and see a fierce shot higher in the price action.
SOL price could go as far as $78 in that movie, and bulls would hit the red descending trend line. Depending on the risk-on sentiment and if the dollar is retreating, SOL price would have plenty of tailwinds to break out of the downtrend that began in April and see massive inflow from investors awaiting a critical signal that the downtrend has come to an end. That would see a solid rally in Solana price toward $95.31, just below the 55-day SMA.
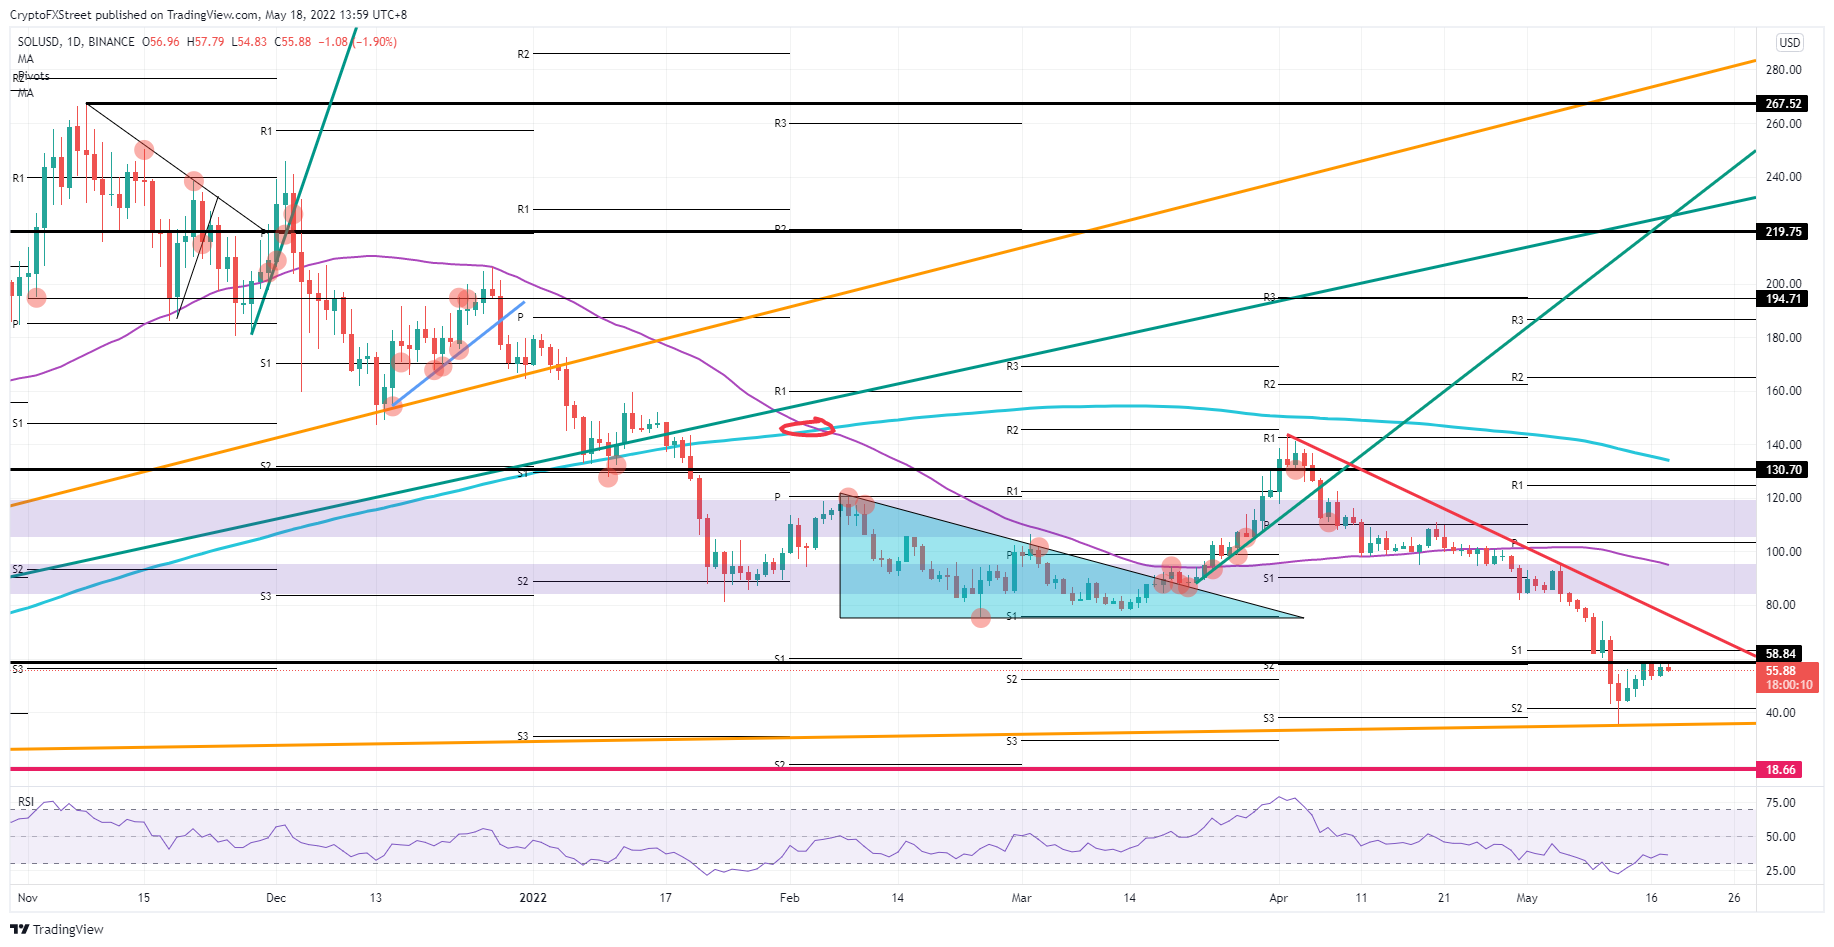
SOL/USD daily chart
As markets moved a lot yesterday, some assets are now trading at critical levels that could see a rejection. The same goes for both the dollar and Solana price, with that last one pressing on the $58.84 level and possibly seeing a rejection to the downside; Bears would see bulls fading and trigger a drop back toward $40.00. If some new negative headlines push markets back into winter mode, expect to see a nose dive move toward $18.66.
Author

Filip Lagaart
FXStreet
Filip Lagaart is a former sales/trader with over 15 years of financial markets expertise under its belt.



