Solana bulls prepare for a comeback
-
Solana forms bullish candlestick pattern near two-month low.
-
Recovery likely, but break above 152.60 needed to trigger fresh buying interest.

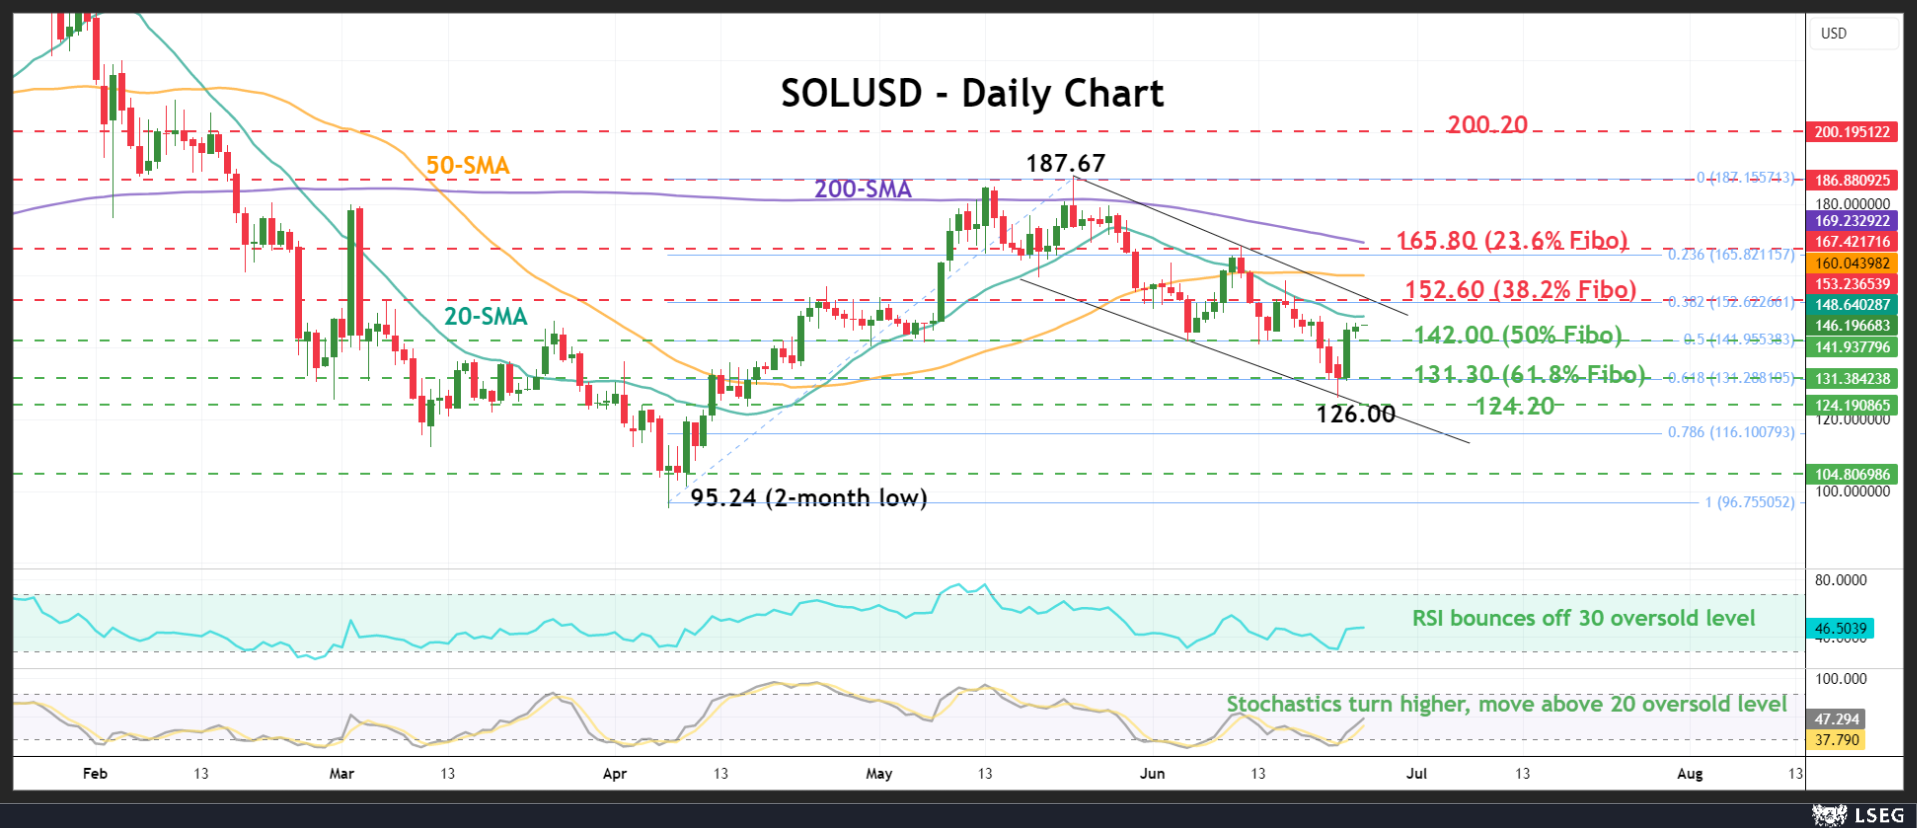
SOLUSD (Solana) caught traders' attention following the formation of a bullish reversal candlestick pattern near the two-month low of 126.09 on Tuesday.
Record CME futures activity and the launch of a Solana Economic Zone in Kazakhstan have brought the bulls back into play. With both the RSI and the stochastic oscillator rebounding from oversold territory, there is growing optimism that the price could reach higher levels in the short term.
However, the market action appears to be contained within a downward-sloping channel, and the bearish crossover between the 20- and 50-day simple moving averages (SMAs) casts doubt on the potential for a bullish breakout.
Nevertheless, if the price breaks above the bearish formation at 152.60, it could next target the 200-day SMA, which is currently converging with the 23.6% Fibonacci retracement level at 165.80. A move above this level would confirm a short-term bullish trend reversal, likely paving the way toward the double-top region at 187.67. From there, attention could shift to the next resistance area around 200.20.
On the downside, the 50% Fibonacci retracement level at 142.00 will be closely watched. If this support level fails, the token may retest the pivot zone near the 61.8% Fibonacci level at 131.30 or find support at the lower boundary of the channel, around 124.20. Further declines from there could increase selling pressure, pushing the price closer to the key psychological level of 100.00.
Overall, Solana appears poised for its next recovery phase. A decisive break above 152.60 could be crucial in reigniting fresh buying interest, while a sustained rally above 165.80 may shift focus back to the spring's upward pattern.
Author

Christina joined the XM investment research department in May 2017. She holds a master degree in Economics and Business from the Erasmus University Rotterdam with a specialization in International economics.


