Solana-based Meme Coins: PENGU, SPX eye further gains as selling pressure wanes
- Pudgy Penguins prepare to break out of a short-term consolidation as bearish pressure subsides.
- SPX6900 meme coin eyes a bounce back within a rising wedge pattern.
- The Open Interests of the meme coins have stabilized after a steep correction, suggesting a halt in capital outflow.

Solana-based meme coins, such as Pudgy Penguins (PENGU) and SPX6900 (SPX), rank among the top performers in the cryptocurrency market over the last 24 hours, at press time. The technical and derivative data indicate increased reversal chances, as the meme coins' spot price and Open Interest hold at a crucial support level after a declining trend last week.
PENGU’s rising open interest boosts optimism
PENGU edges lower by 1% at press time on Thursday after gaining 6.48% on Wednesday. The Solana-based meme coin consolidates above the $0.03000 round figure after last week’s downfall.
PENGU struggles to overcome the 78.6% Fibonacci level at $0.03717, which is drawn from $0.07000 on December 17 to $0.00370 on April 9. A decisive push above this level could fuel a reversal rally to the $0.04714 level marked by the high of January 6.
The Moving Average Convergence Divergence (MACD) line declines with its signal line, indicating a bearish trend. However, the declining intensity of red histograms suggests a weakening in bearish momentum.
The Relative Strength Index (RSI) reads 55 on the daily chart as it moves almost flat above the halfway line, suggesting neutrality in buying/selling pressure.
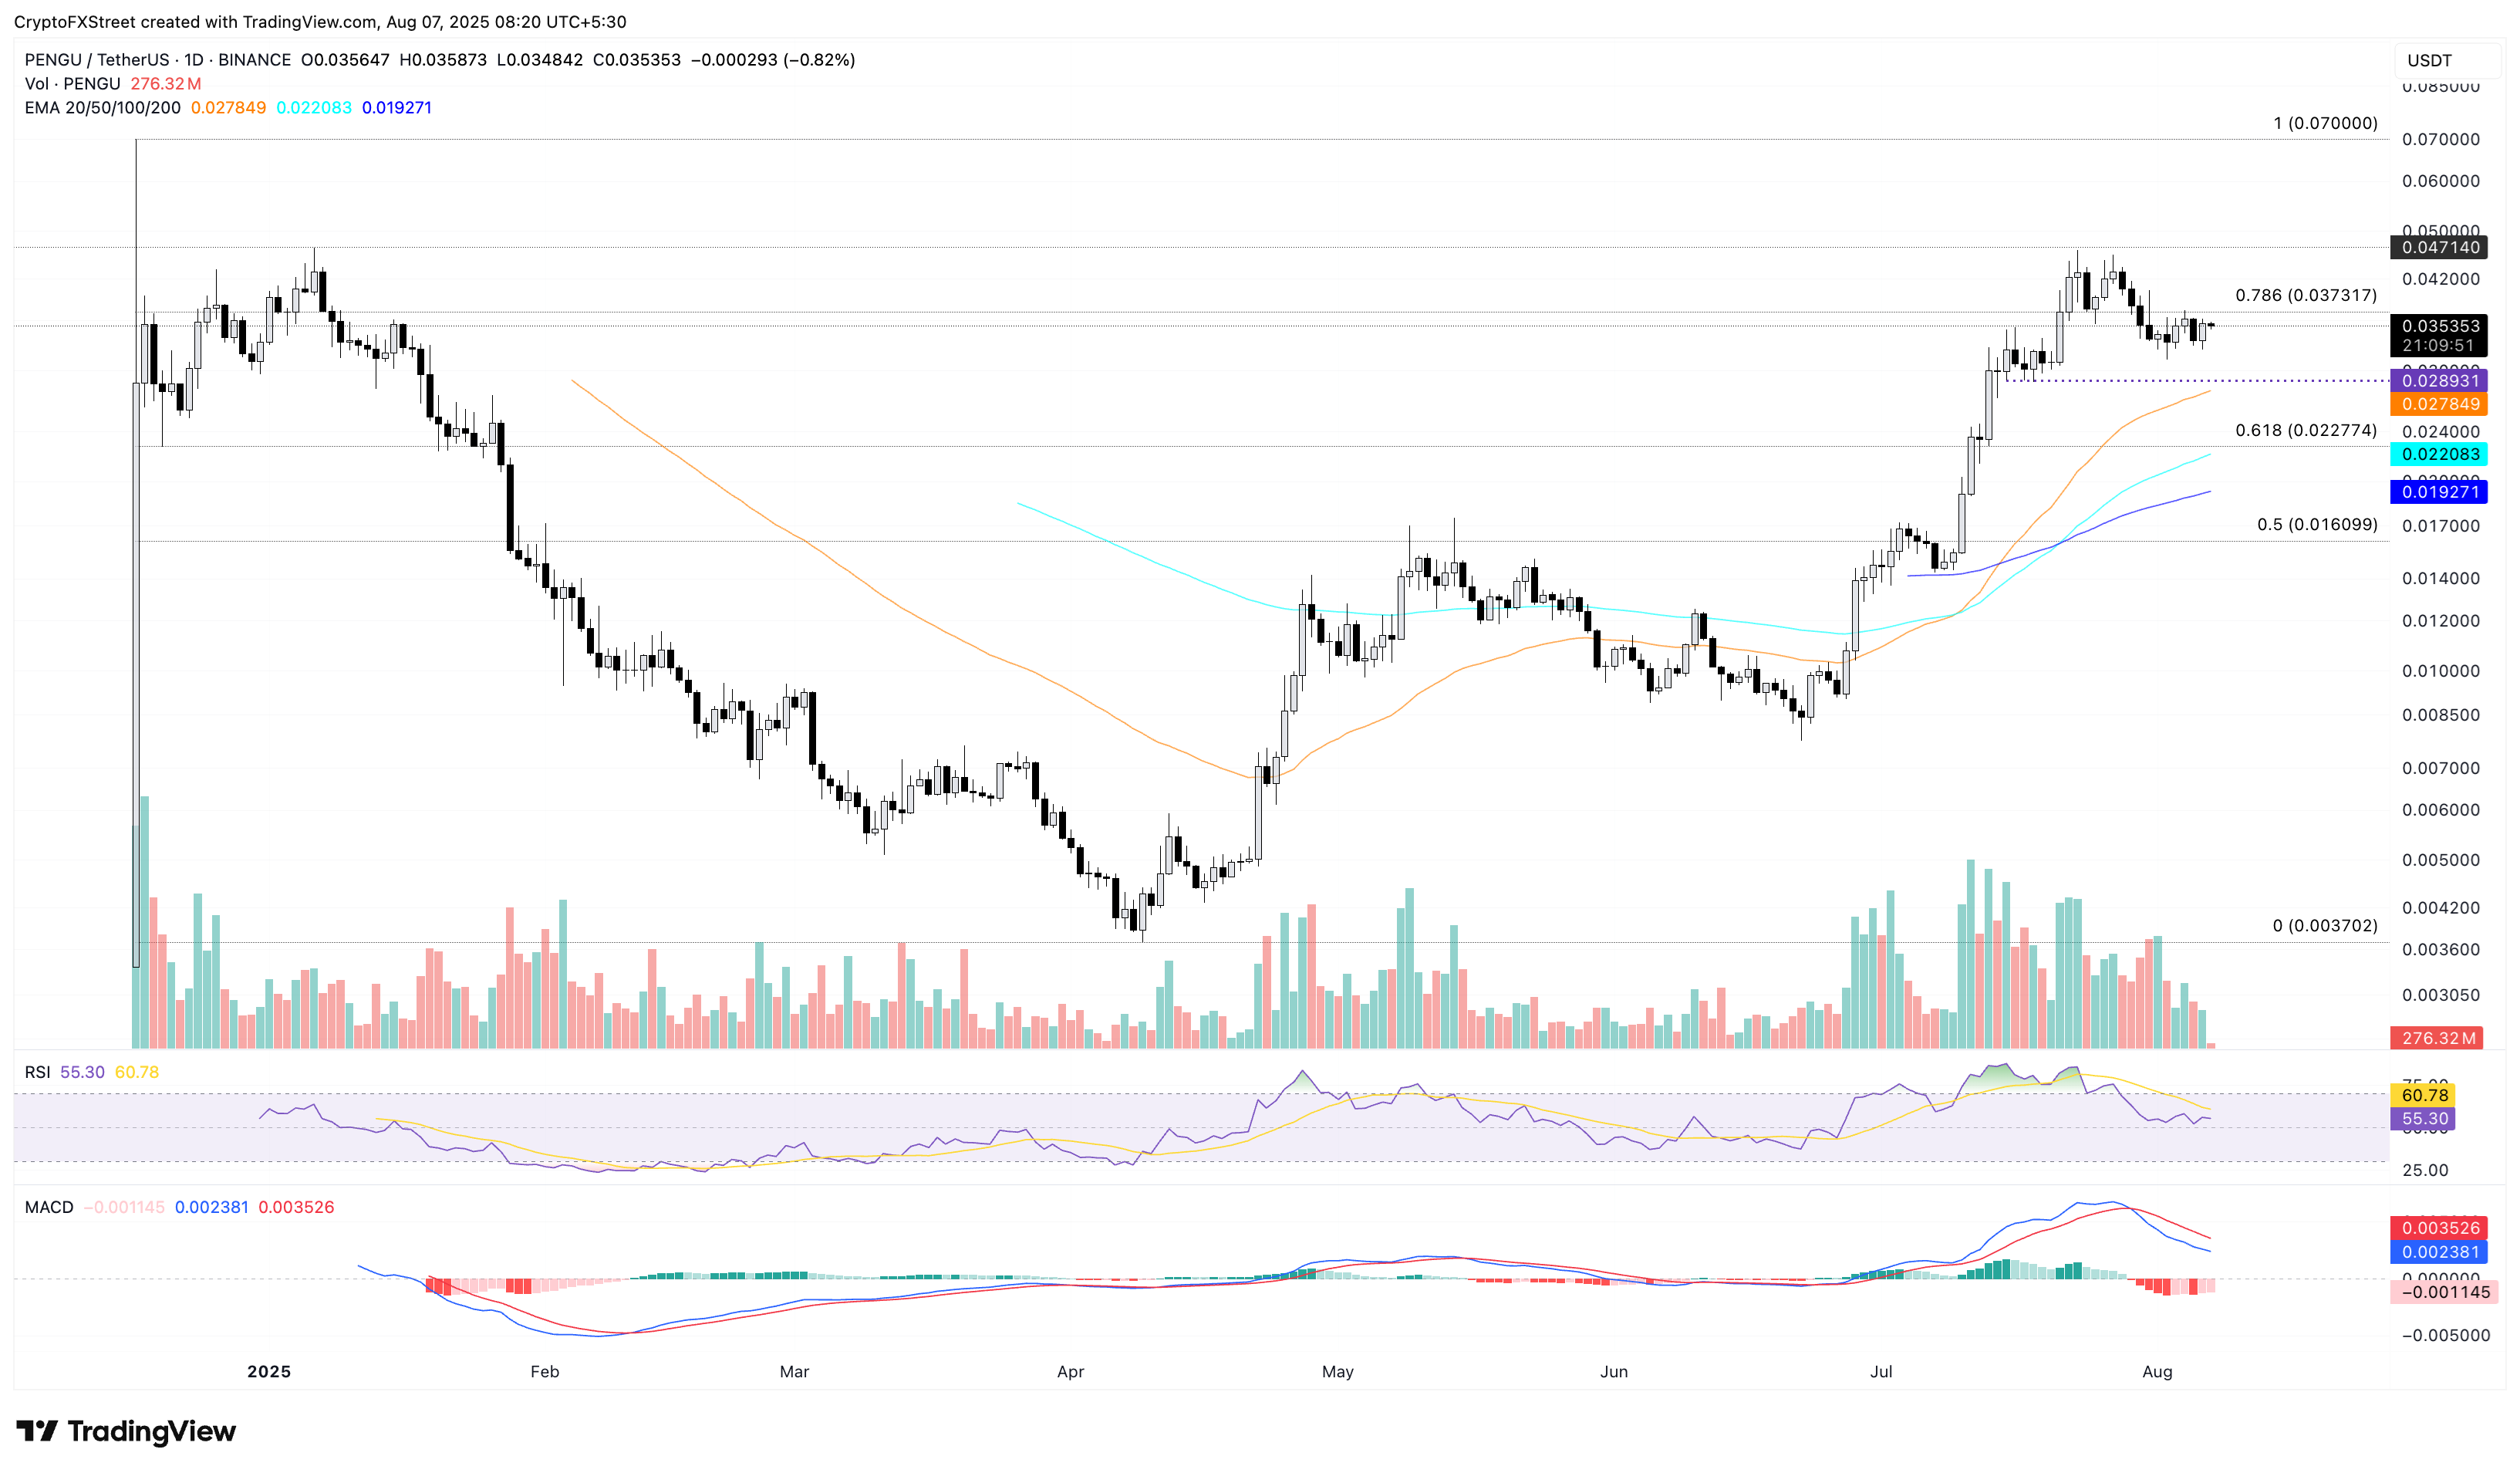
PENGU/USDT daily price chart.
CoinGlass data shows the PENGU Open Interest (OI) has increased by 10% in the last 24 hours, standing at $407.40 million. A surge in OI reflects increased capital inflow as traders gain confidence.
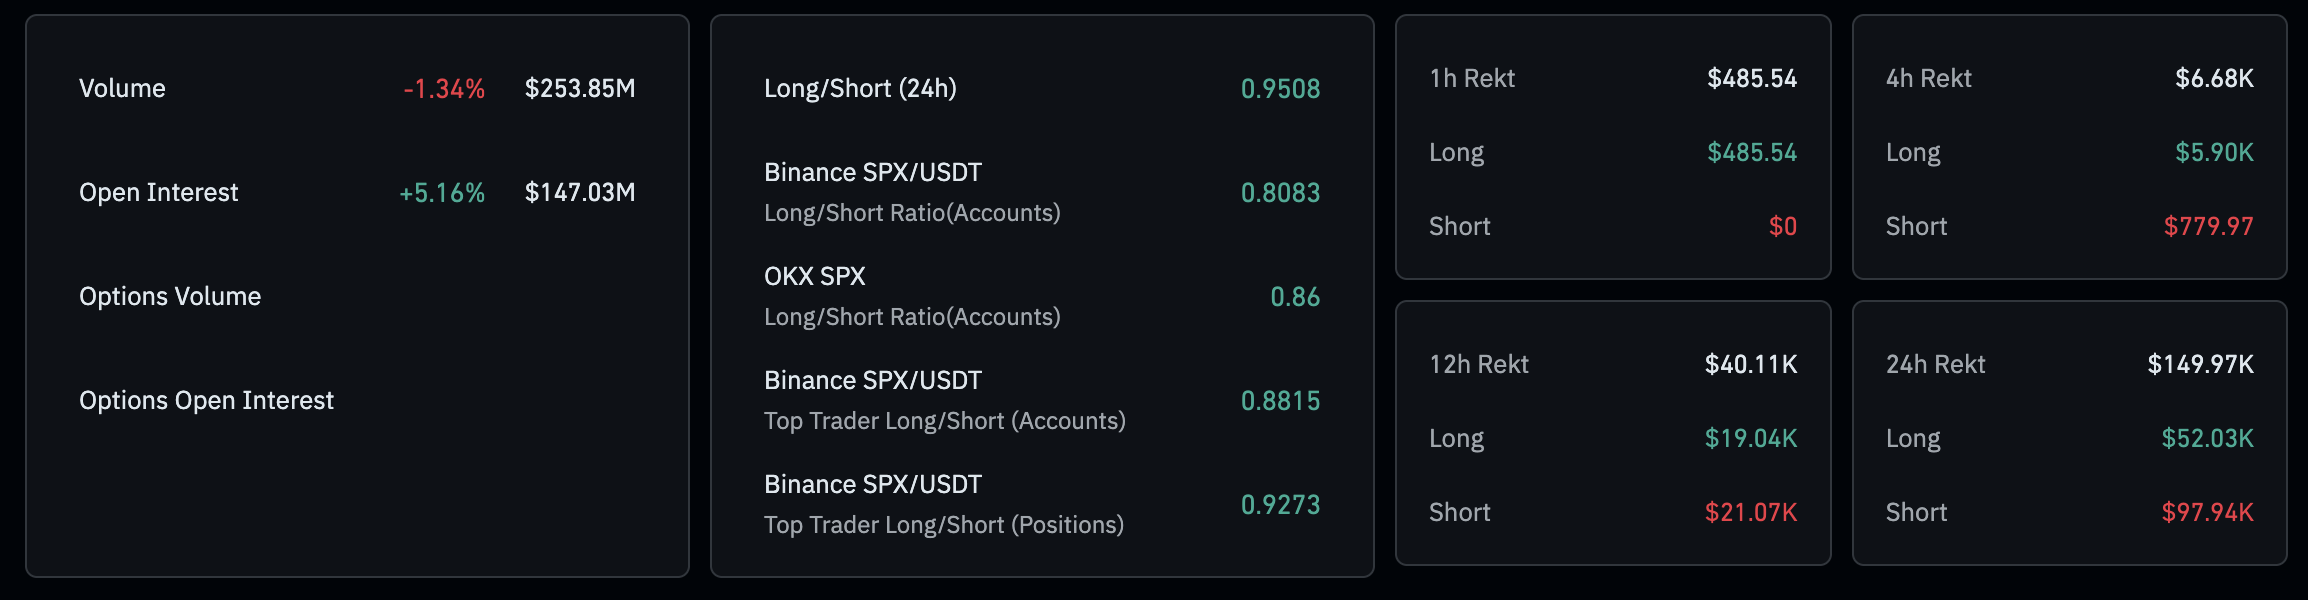
PENGU Open Interest. Source: CoinGlass
On the flip side, a reversal in PENGU from the $0.03717 resistance could retest the $0.02893 support level, marked by the July 15 low.
SPX’s reversal within a wedge could lead to further gains
SPX meme coin holds above the 50-day Exponential Moving Average (EMA) at $1.5717 as it bounces off the support trendline of a rising wedge pattern on the daily chart. At the time of writing, SPX edges lower by 0.50% so far on Thursday following the nearly 3% gains from the previous day.
If SPX marks a clean push above the $1.8032 level, marked by the January 19 peak, it could extend the rally to the previous week’s high at $2.2817.
The bounce back aligns with easing bearish momentum as the MACD line inches closer to its signal line, with the red histogram bars declining, hinting at a potential trend reversal signal.
Furthermore, the RSI stands at 49 on the daily chart, having reached the neutral level after a reversal on Sunday, indicating declining selling pressure.
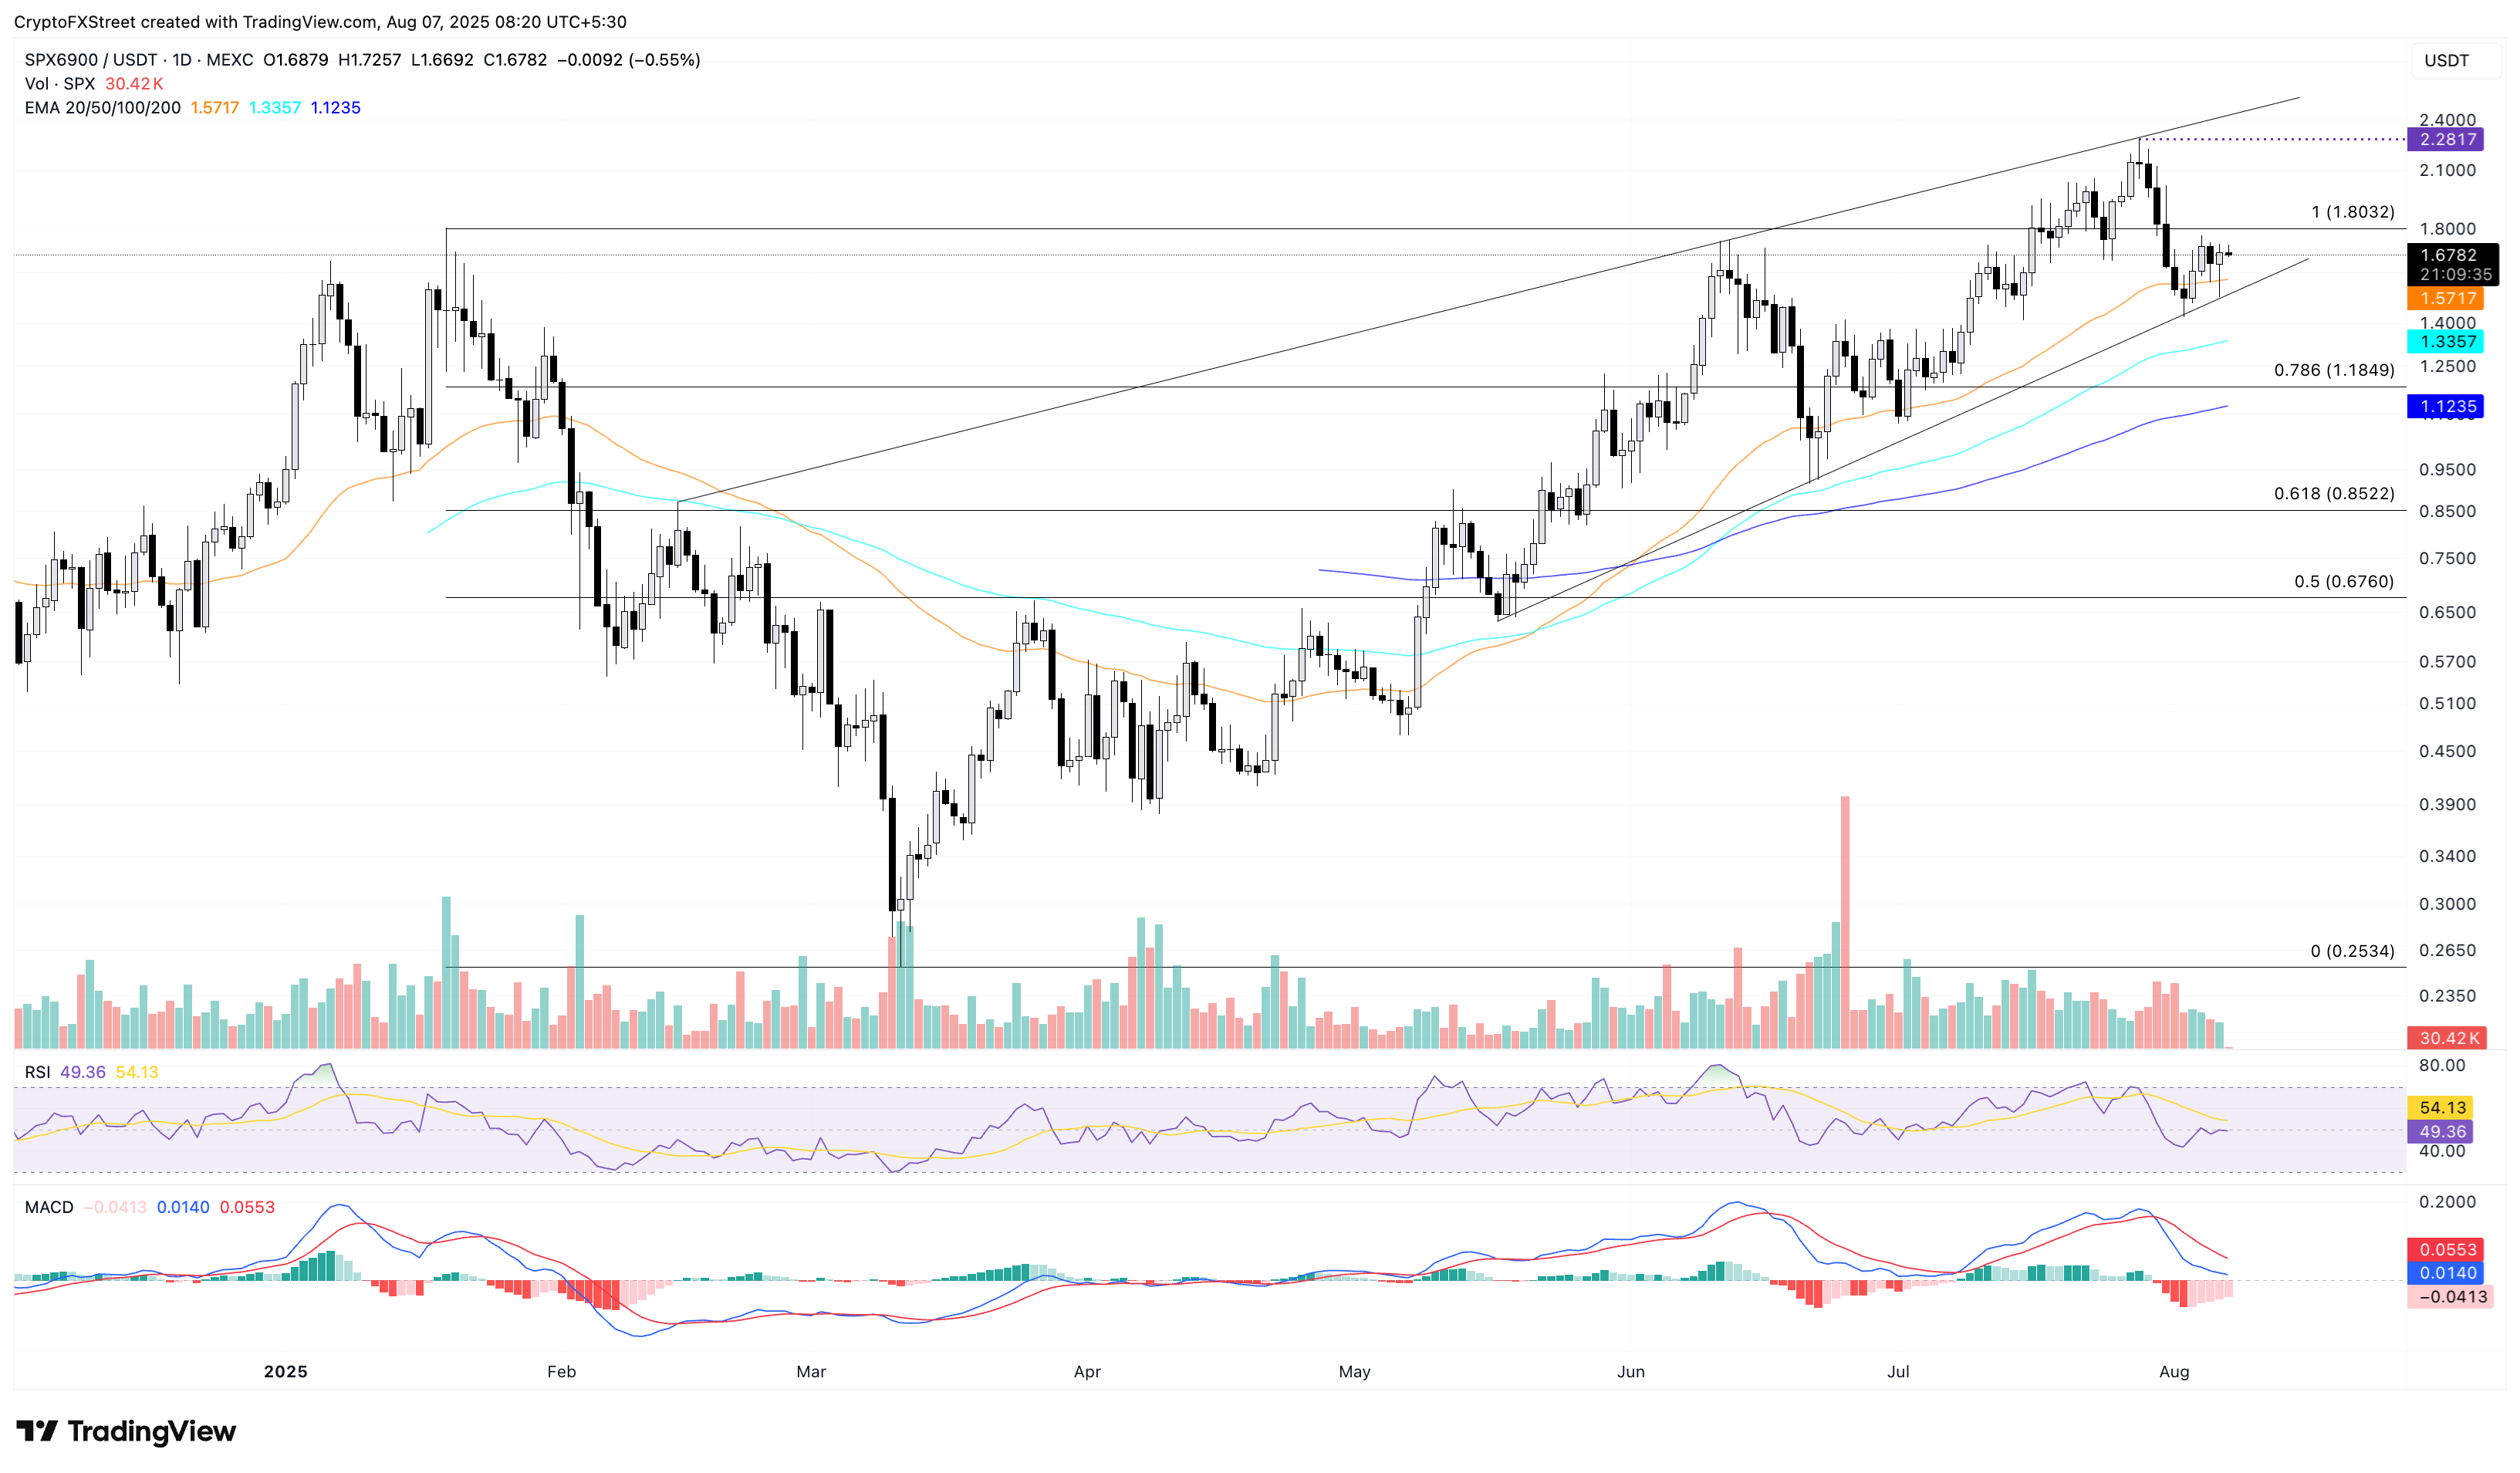
SPX/USDT daily price chart.
Coinglass data shows that the SPX OI stands at $146.73 million at press time, maintaining a stagnant trend after a decline last week, which aligned with the spot price's downfall. As traders regain confidence, a slowdown in capital outflow from SPX futures and options contracts stabilizes OI.
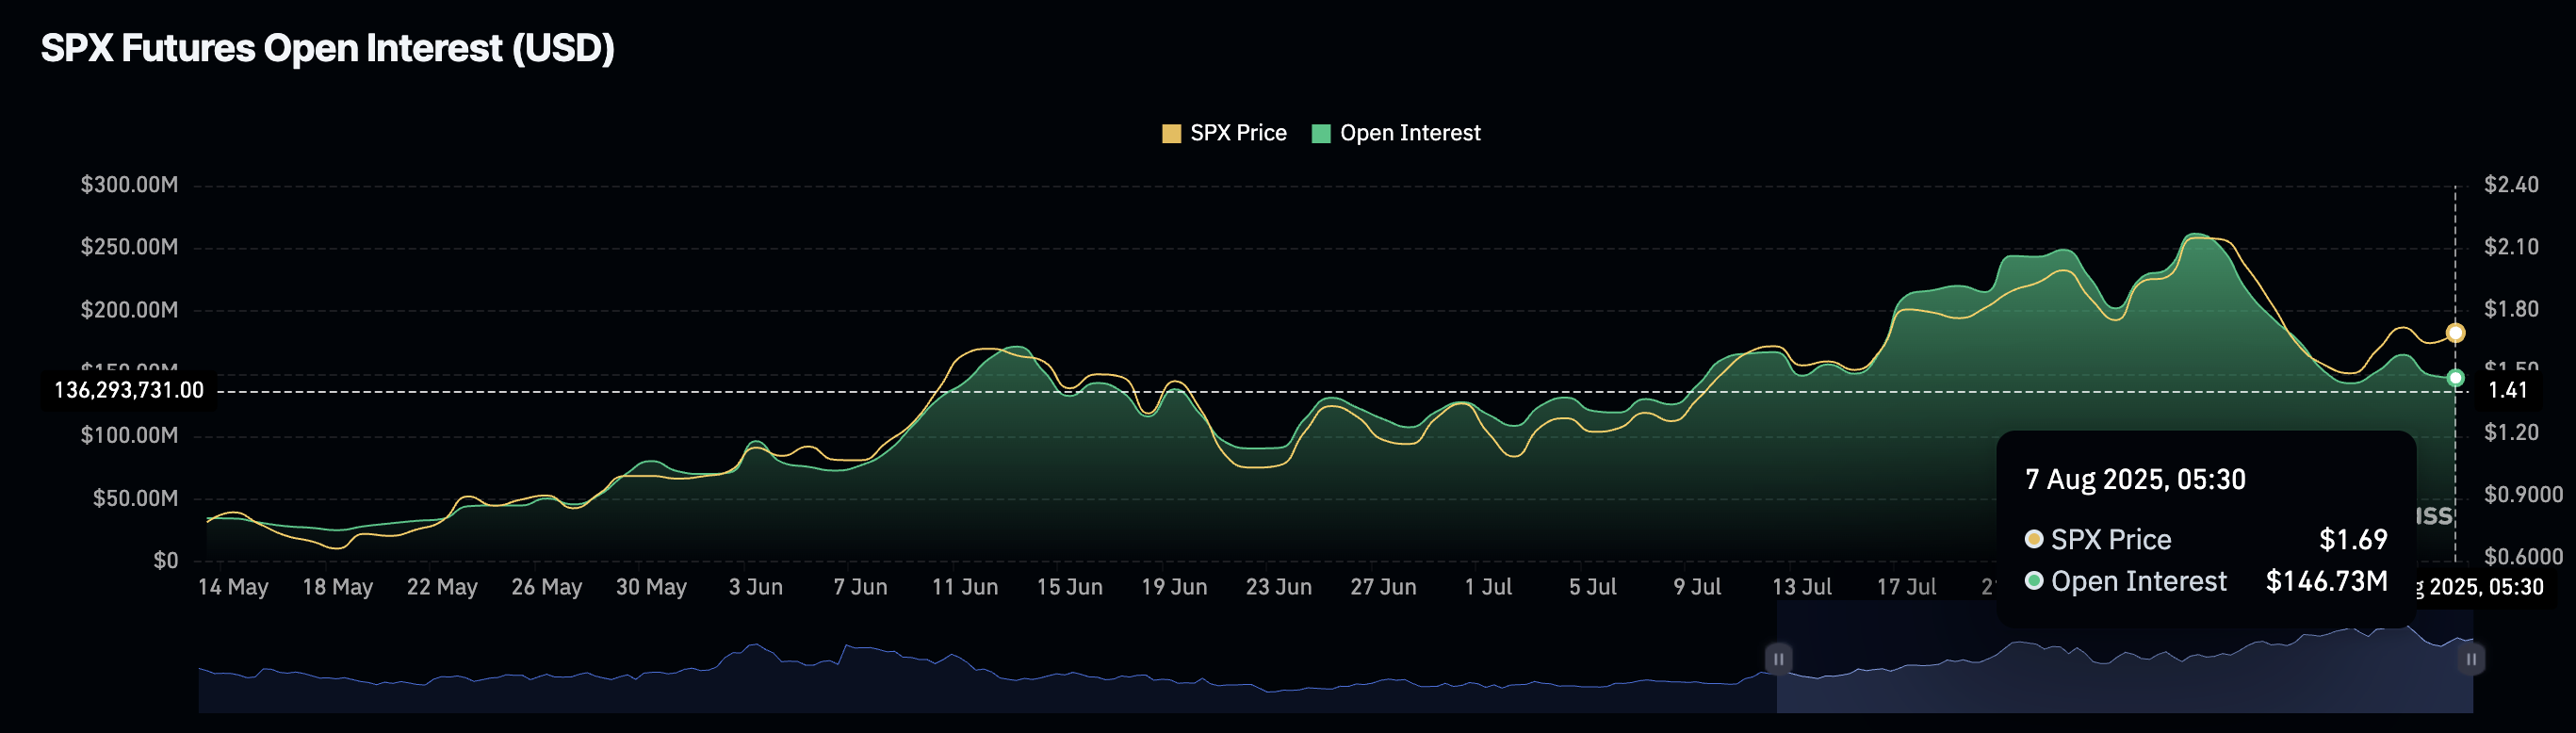
SPX Open Interest. Source: CoinGlass
On the contrary, if SPX continues the prevailing downfall, a decisive close below the support trendline at $1.5000 could extend the decline to the 100-day EMA at $1.3356.
Author

Vishal Dixit
FXStreet
Vishal Dixit holds a B.Sc. in Chemistry from Wilson College but found his true calling in the world of crypto.


