Solana-based Bonk rally shows no signs of faltering as market cap rises 55% in July
- Bonk meme coin extends recovery rally above $0.00003300, underpinned by steady risk-on sentiment in the broader crypto market.
- A Golden Cross confirmed by the 50-day EMA crossing above the 100-day EMA backs the robust bullish structure.
- Investor appetite for BONK remains steady, with the futures’ Open Interest and volume increasing in tandem.

Bonk (BONK) has continued to gain bullish momentum, standing out among other meme coins with intraday gains exceeding 12% on Wednesday. On the backdrop of a 110% surge over the past 30 days, Bonk trades at around $0.00003377 at the time of writing. The surge in Bonk has had a positive impact on the market capitalization, marking a 55% increase in July to $2.55 billion, according to CoinGecko.
Bonk upholds uptrend amid robust investor appetite
Bonk boasts a stable technical structure, which, according to CoinGlass data, is supported by a robust derivatives market. The futures contracts’ Open Interest (OI), which represents the value of all futures and options that have not been settled or closed, has since the beginning of this month exploded, averaging $48 million.
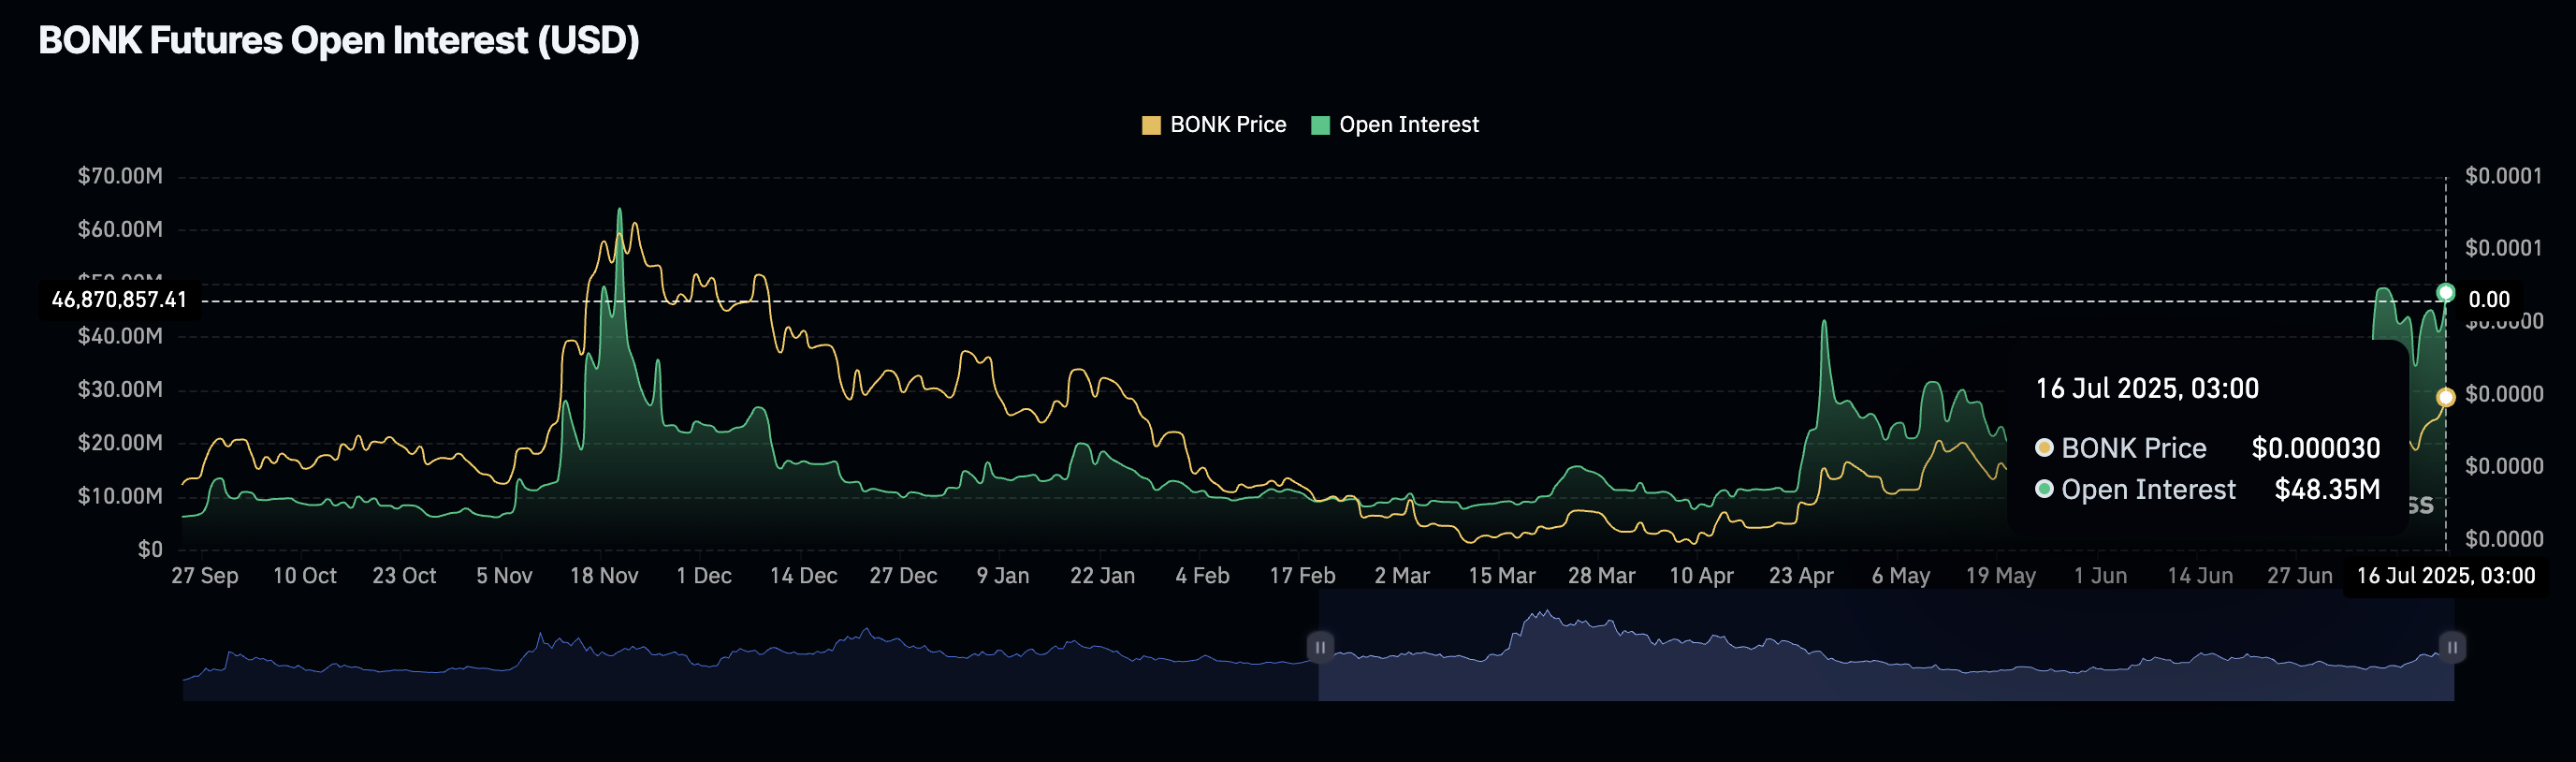
Bonk futures Open Interest data | CoinGlass
A subsequent surge in derivatives trading volume, from approximately $39 million to $618 million over the same period, underscores the steady interest in BONK. Open Interest rising alongside volume implies a higher risk appetite and increased investor confidence in the ecosystem.
Bonk price has the potential to extend the uptrend toward resistance at $0.00004000 if the derivatives market upholds the bullish trend in the coming days or weeks.
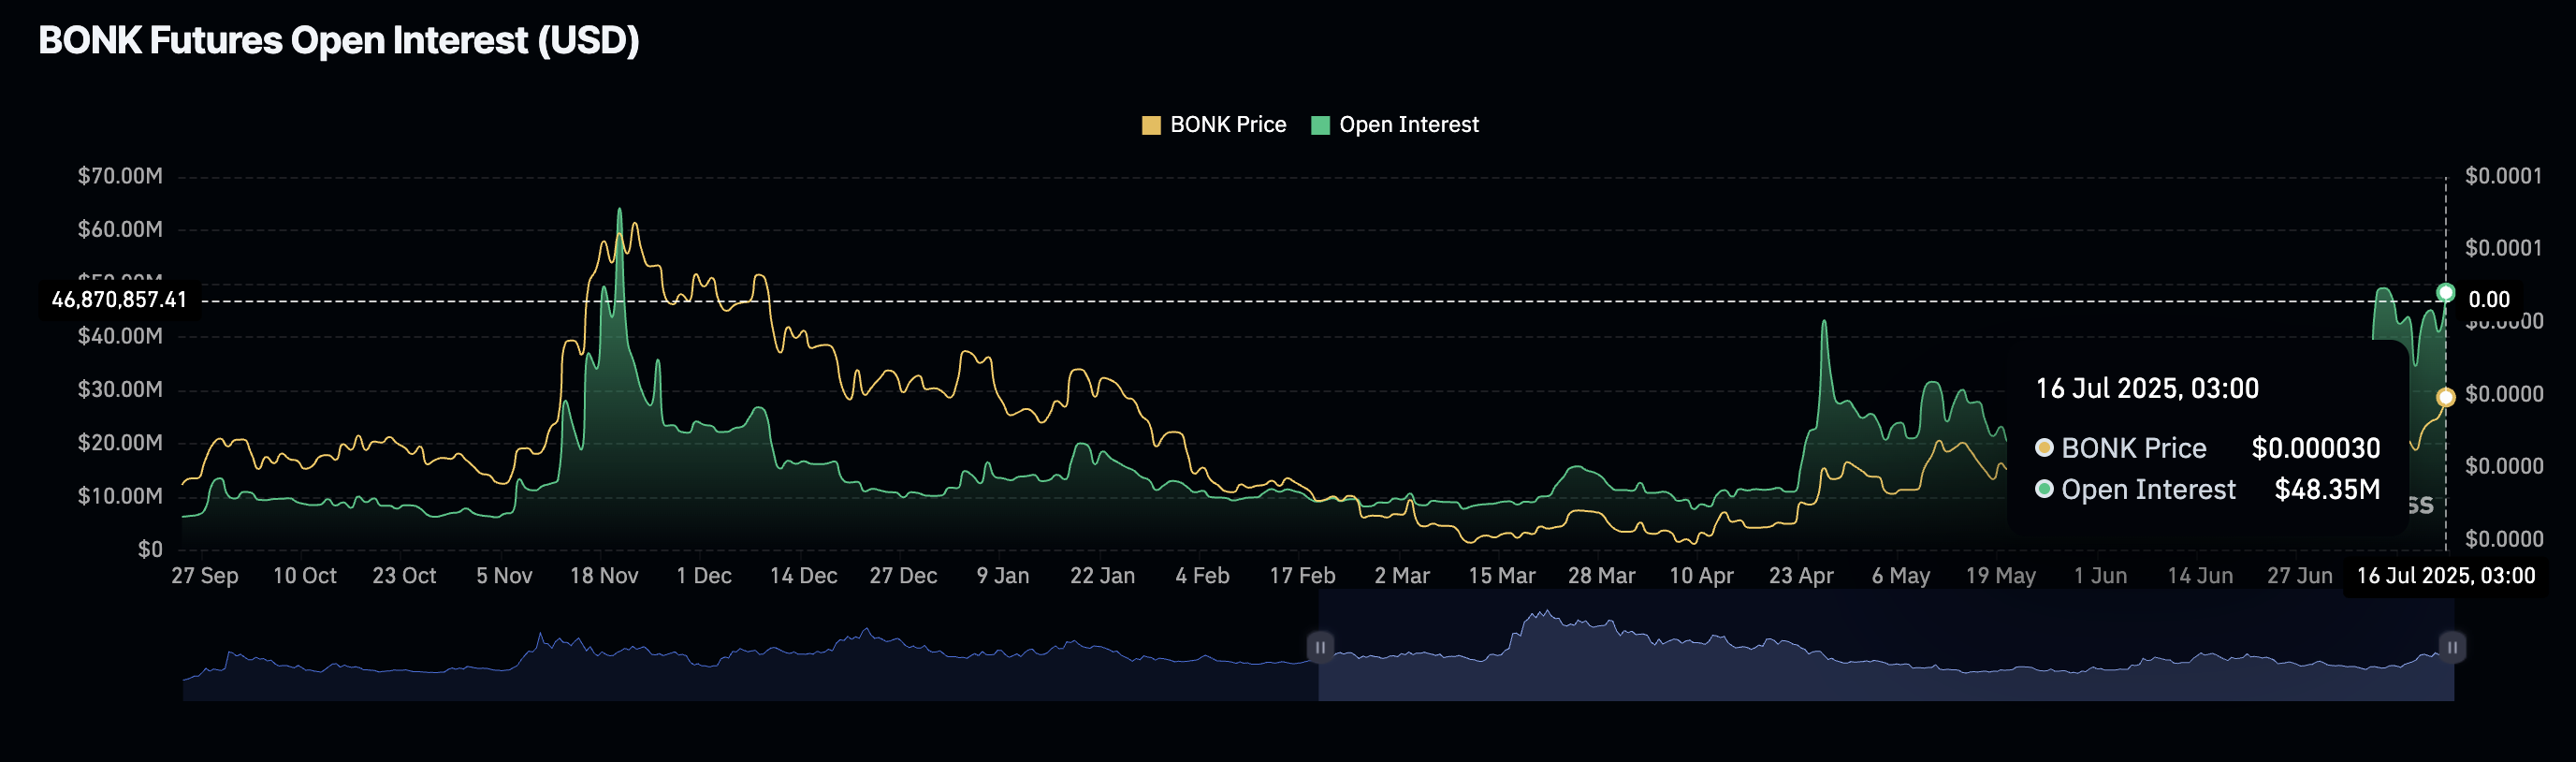
Bonk futures volume | CoinGlass
Technical outlook: Bonk holds bullish structure
Bonk price’s rebound remains steady at the time of writing, after gaining for five consecutive days. The Moving Average Convergence Divergence (MACD) indicator has sustained a buy signal since June 28, underpinning the bullish momentum. This signal is characterized by the blue MACD line crossing above the red signal line, while green histogram bars expand above the zero line, thereby encouraging traders to increase exposure.
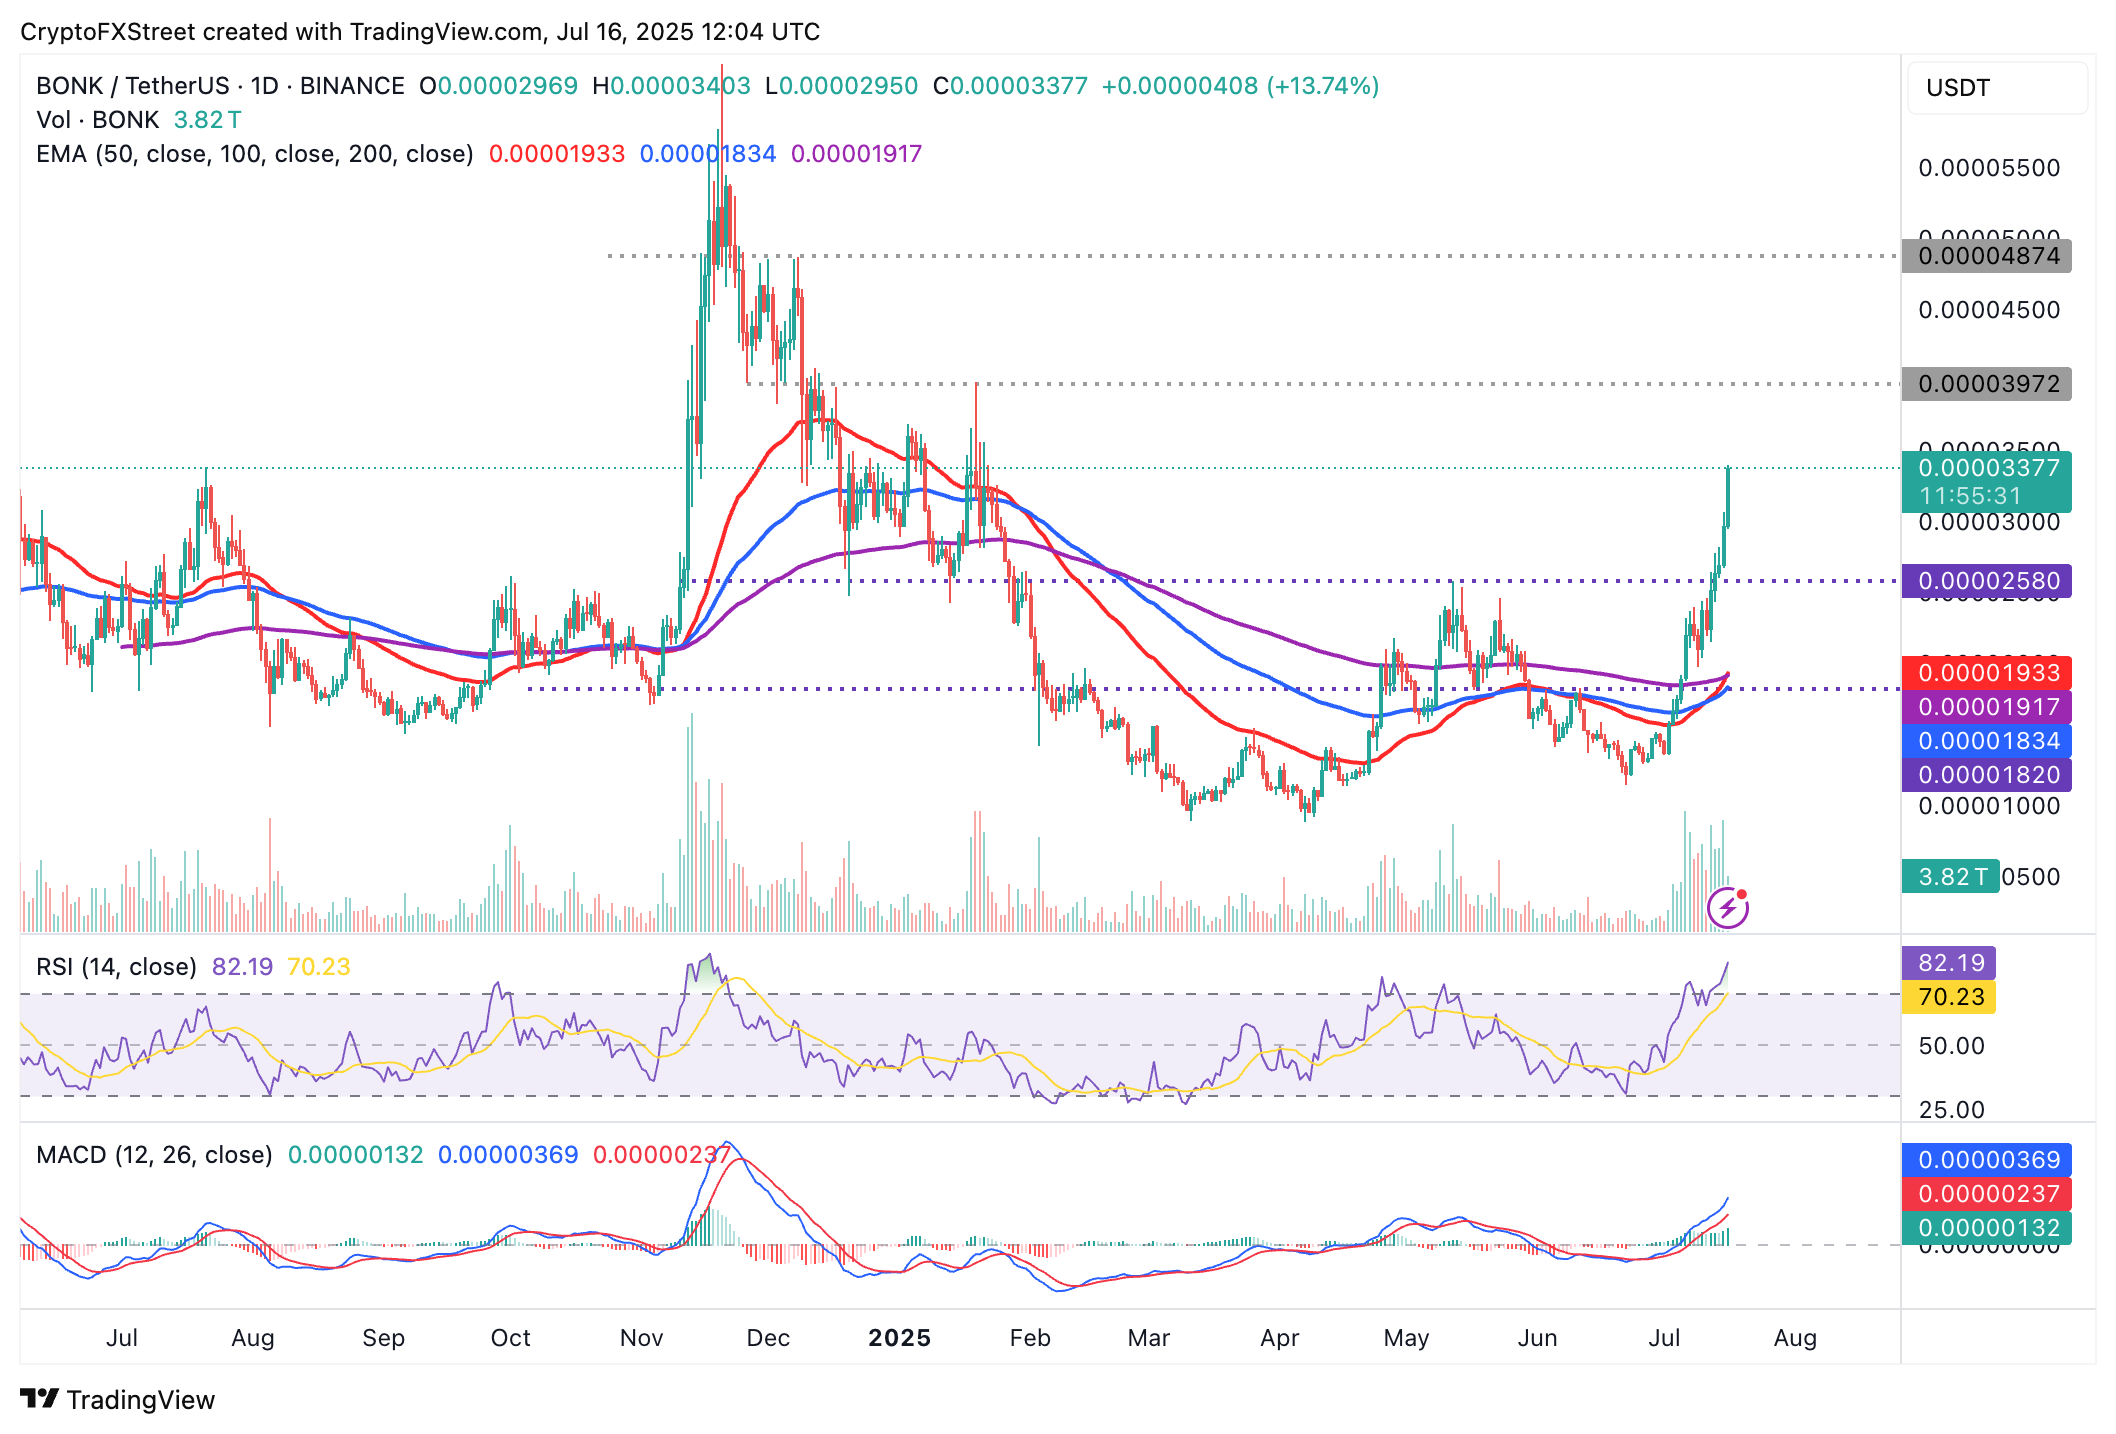
BONK/USDT daily chart
The confirmation of a Golden Cross pattern when the 50-day Exponential Moving Average (EMA) crossed above the 100-day EMA on Saturday solidifies the bullish technical structure.
Traders will likely hold their long positions anticipating the Bonk price to rise further toward the short-term target at $0.00004000 and $0.00005000 in the near term.
Still, traders should temper their expectations, particularly given that the Relative Strength Index (RSI) is overbought, which could result in a trend reversal as the market overheats. It is worth monitoring the RSI’s movement to gauge the uptrend strength, with a reversal into the neutral region signaling a reduction in buying pressure.
Key levels to monitor and prepare for, as tentative support, include $0.00003000, tested in December, and the confluence of the 50-day EMA and the 200-day EMA at around $0.00001935.
Open Interest, funding rate FAQs
Higher Open Interest is associated with higher liquidity and new capital inflow to the market. This is considered the equivalent of increase in efficiency and the ongoing trend continues. When Open Interest decreases, it is considered a sign of liquidation in the market, investors are leaving and the overall demand for an asset is on a decline, fueling a bearish sentiment among investors.
Funding fees bridge the difference between spot prices and prices of futures contracts of an asset by increasing liquidation risks faced by traders. A consistently high and positive funding rate implies there is a bullish sentiment among market participants and there is an expectation of a price hike. A consistently negative funding rate for an asset implies a bearish sentiment, indicating that traders expect the cryptocurrency’s price to fall and a bearish trend reversal is likely to occur.
Author

John Isige
FXStreet
John Isige is a seasoned cryptocurrency journalist and markets analyst committed to delivering high-quality, actionable insights tailored to traders, investors, and crypto enthusiasts. He enjoys deep dives into emerging Web3 tren



