Smart money accumulation signals a 60% upswing for Shiba Inu price
- Shiba Inu price is coiling inside a descending triangle, hinting at a breakout soon.
- Investors can expect a bullish breakout leading to a 26% upswing to $0.0000150.
- A four-hour candlestick close below $0.0000106 will invalidate the bullish thesis.
Shiba Inu price continues to coil up as it trades every single day. After reaching a critical point, the momentum will collapse to one side, resulting in a breakout. Considering the market structure of Bitcoin and the recent pullback, a bullish move seems likely for SHIB.
Shiba Inu price consolidates
Shiba Inu price set up two lower highs and two equal lows since the May 12 crash. Connecting the swing points using trend lines results in a descending triangle. This technical formation forecasts a 26% move to $0.0000150, obtained by measuring the distance between the first swing high and low to the breakout point at $0.0000118.
As mentioned earlier, Bitcoin is displaying a bullish outlook, so investors can expect Shiba Inu price to follow suit. However, there could be another retest of the descending triangle’s base at $0.0000106 before the breakout occurs.
In some cases, the run-up could push Shiba Inu price to retest the $0.0000161 hurdle, bringing the total gain to 60%.
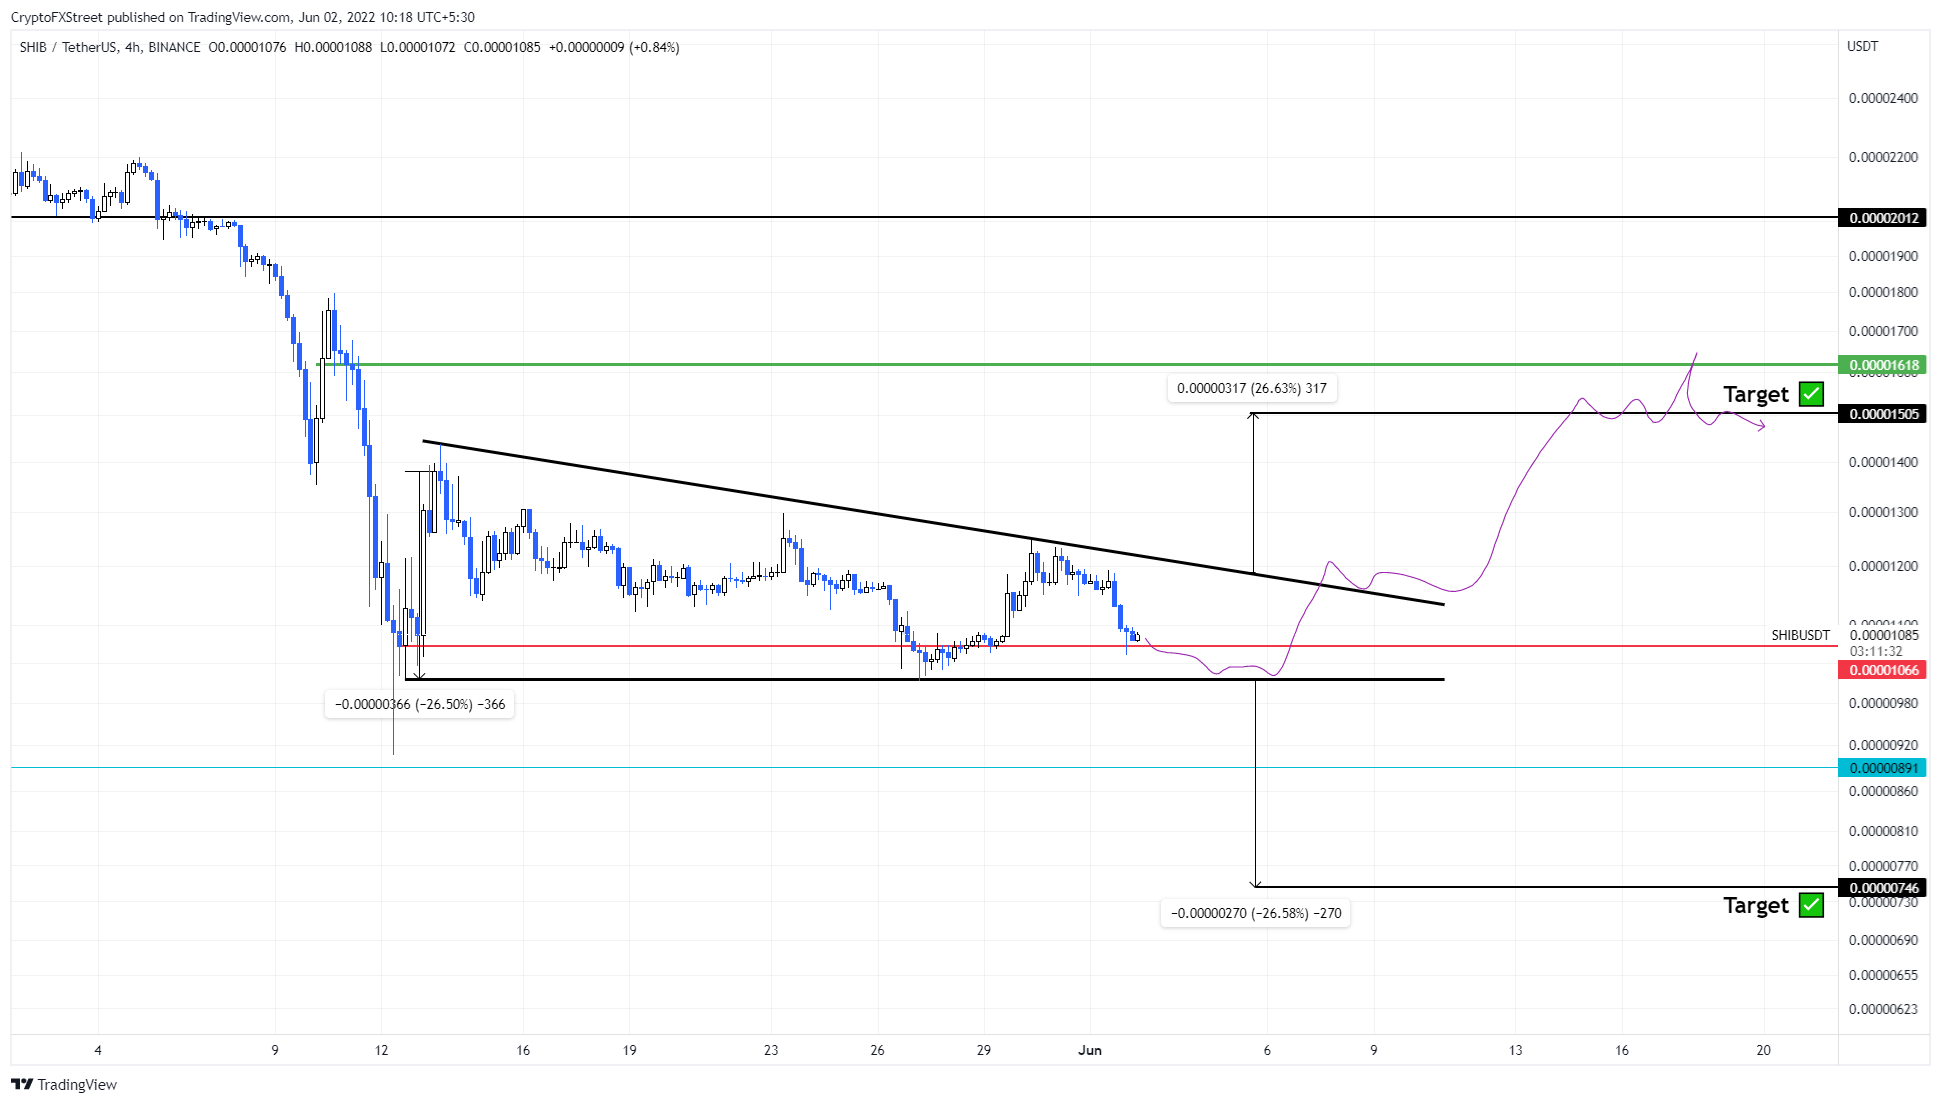
SHIB/USDT 4-hour chart
Perhaps the most important on-chain metric that aptly reveals the bullish outlook for Shiba Inu price is the 30-day Market Value to Realized Value (MVRV)
This on-chain metric is used to determine the average profit/loss of investors that purchased SHIB over the past month. Based on Santiment’s research, a value below -10% to -15% indicates that short-term holders are at a loss and are less likely to sell.
More often than not, this is where long-term holders accumulate. Hence, any move below -10% is termed an “opportunity zone.”
For SHIB, the 30-day MVRV slipped below the last two local bottoms at -34% and set a low at -44% on My 13. However, investors seem to be accumulating as seen in the recent uptick to -13%.
Interestingly, if this trend continues, the MVRV could form a local top of around 15% or 30%, suggesting that there is more room for Shiba Inu price to move higher as long-term holders continue to accumulate.
 [09.20.12, 02 Jun, 2022]-637897420947500894.png)
SHIB MVRV 30-day chart
While things are looking up for Shiba Inu price, a four-hour candlestick close below $0.0000106 will trigger a bearish breakout and invalidate the bullish thesis. This move will likely trigger a 26% crash to $0.0000074.
Author

Akash Girimath
FXStreet
Akash Girimath is a Mechanical Engineer interested in the chaos of the financial markets. Trying to make sense of this convoluted yet fascinating space, he switched his engineering job to become a crypto reporter and analyst.


