Should APE traders ignore sell-off and buy into the underpinning of ApeCoin price action?
- ApeCoin price gets underpinned this Thursday in a challenging market environment that is looking for direction.
- APE price is, next to several other cryptocurrencies, at the crossroads of either continuing its rally or breaking it.
- Expect to see a bounce going into the last stretch for the summer rally.

ApeCoin (APE) price action is being underpinned by a trifecta of technical elements that are holding back bears for now and preventing another leg lower. The summer rally still has some room to go, but traders need to hurry up as once September kicks in, investors will refocus and preposition for hawkish comments from central banks that could weigh heavily on their positions – especially if they reiterate their hawkish rhetoric from before the summer. Expect to see a rally towards $9.50 or 55% in the best-case scenario, eked out in the last two weeks of the month.
APE price can still rally 55% at best
ApeCoin price took a step back these past two weeks as it fell from its high of August by roughly 21%, making it the Manchester United of the major cryptocurrencies. Although the lookout is dire, help is underway from the Relative Strength Index (RSI) which is showing a positive divergence. As the RSI has dipped substantially, it makes sense for bulls to jump in and start building a stake in ApeCoin now given the indicator holds plenty of upside potential.
APE price is underpinned by the 55-day Simple Moving Average (SMA), the monthly pivot around $6.10 and nearby support from the low of May 27, 2022, at $5.79. A bounce off there would see APE price action swing back to a descending red trend line – with a possible break above it afterward. Once broken, expect a massive rally towards $9-$9.50 with new highs for August.
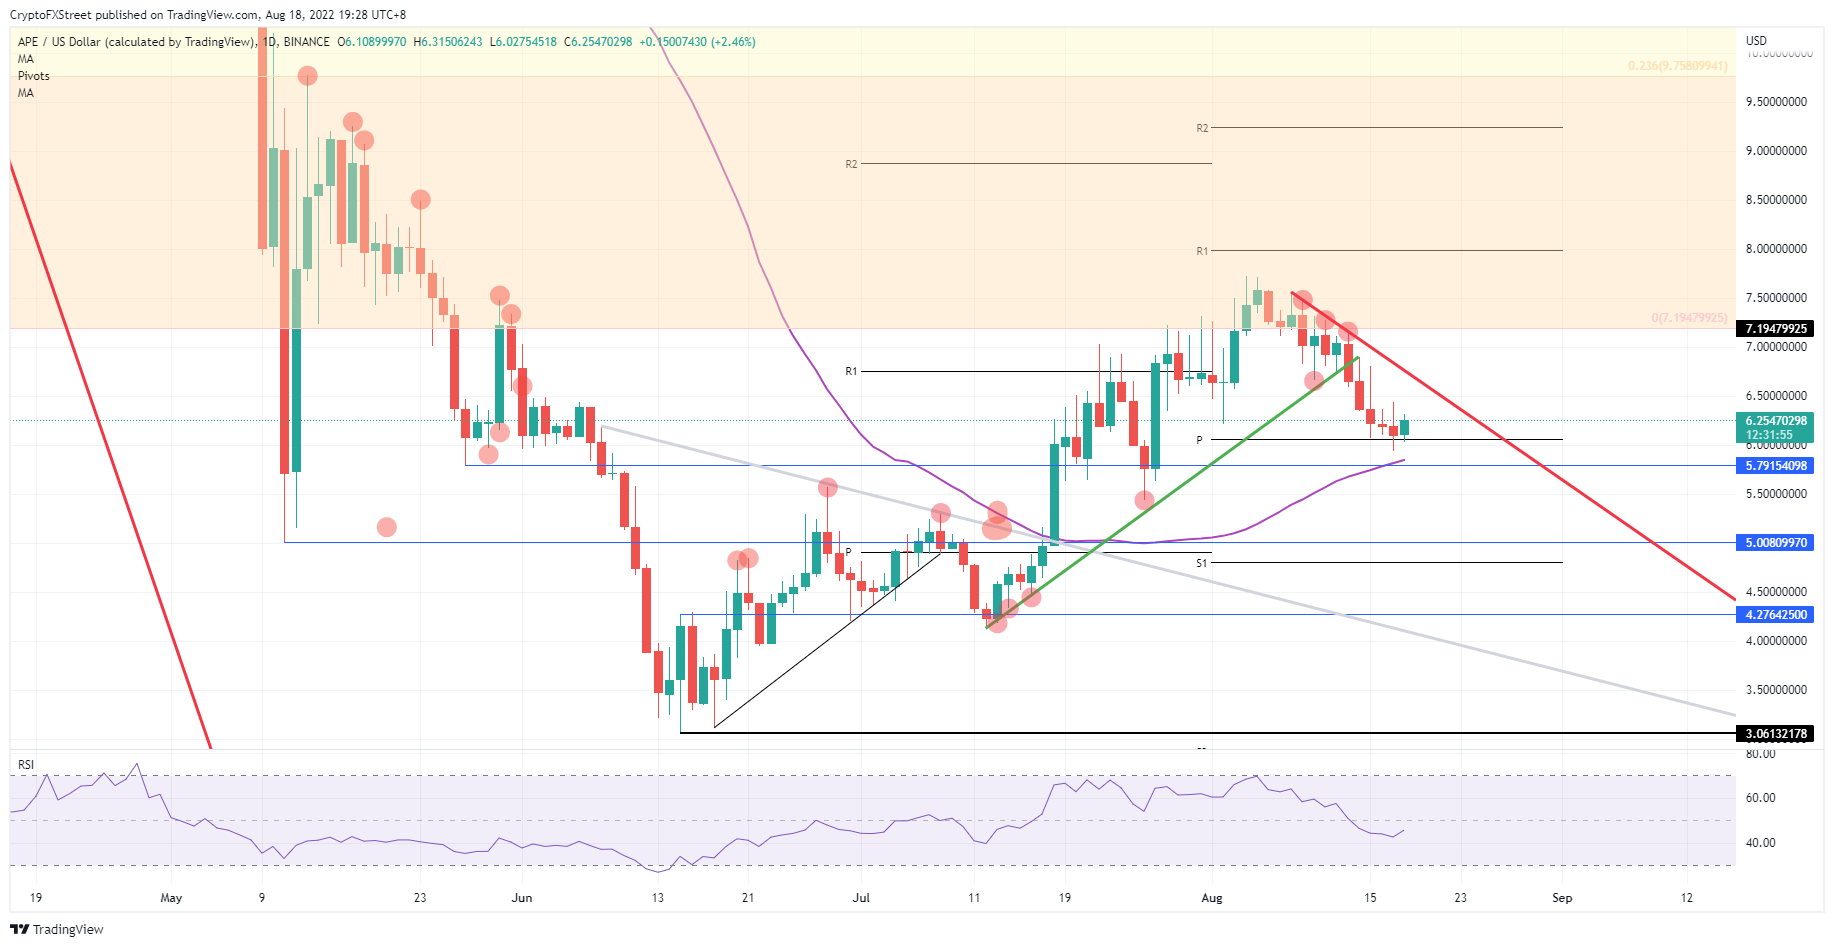
APE/USD Daily chart
The risk to the downside comes if the pop turns out to be simply some ventured buying at the monthly pivot. In such a scenario bears will be quick to jump on the rally and squash price action back to that same pivot level. Support can only hold that long and a break would likely see price action fall below the 55-day SMA for the first time in August. After that, expect to see a further collapse towards $5, the line in the sand and the last line of defence for APE price before a break down to its lowest levels for 2022.
Author

Filip Lagaart
FXStreet
Filip Lagaart is a former sales/trader with over 15 years of financial markets expertise under its belt.



