Is ApeCoin price the sleeping giant you should be paying attention to?


  • ApeCoin price bulls go head to head with bears to defend important support at $6.00.
  • Multiple buy signals from the SuperTrend and the TD Sequential indicators print out a bullish picture for ApeCoin price.
  • Buyers must bring their A-game to deal with challenging resistance between $6.24 and $6.42.

ApeCoin price is taking a breather slightly above $6.20 after its uptrend got rejected from the selling pressure buildup around $7.50. Support at $6.00 will confirm stability in the market and create a conducive environment for investors to get back in the game and push for the much-awaited ascent to $10.00 and $20.00, respectively.

ApeCoin price is on the brink of reigniting the uptrend

The TD Sequential indicator has sent a buy signal on the daily chart. This call to go all-in on APE manifested in a red nine candlestick implying that the correction from $7.50 is losing momentum fast. Traders are often advised to place buy orders when the low of the sixth and seventh candles in the count is exceeded by the low of the seventh and ninth bars – something which has happened on the latest decline.

Another buy signal from the Super Trend indicator shows that bulls are the likely winners of the tug of war marginally above APE’s immediate support at $6.00. When this indicator turns green and begins trailing ApeCoin price, it means that odds are tipped in favor of an imminent uptrend.
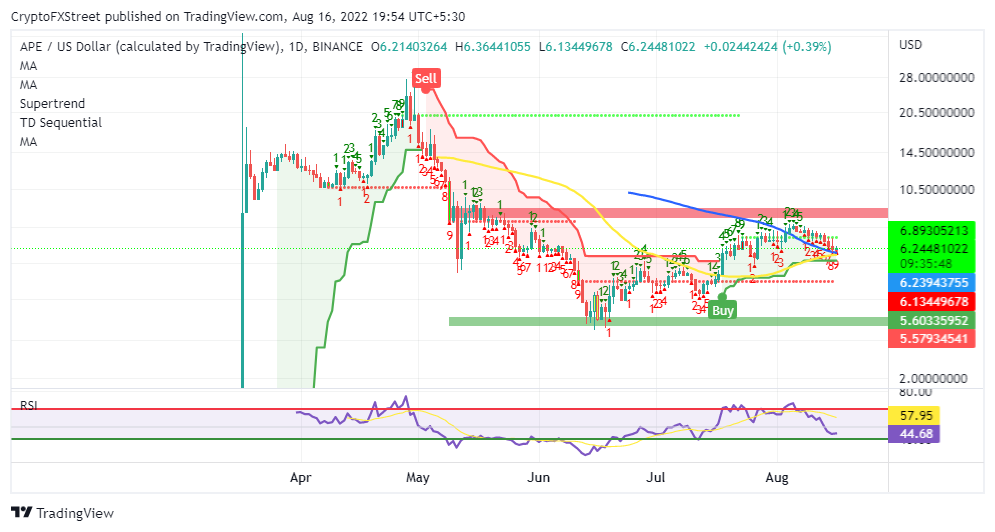
ApeCoin price

APE/USD daily chart

A confluence formed by the 50-day Simple Moving Average (SMA) and the 100 SMA adds credence to the bullish narrative. Put in another way, ApeCoin price has a good chance of spiking above the resistance ($7.50) as opposed to extending the down leg to its immediate support at $3.50.

IntoTheBlock’s IOMAP model’s outlook contradicts the above bullish analysis by bringing to light a solid resistance between $6.24 and $6.42. Approximately 2,220 addresses previously bundled up 32.50 million APE tokens in this range.

As ApeCoin price strides to escape the bearish shackles, the same holders are likely to consider selling at their respective breakeven points, thus delaying or sabotaging the uptrend entirely.

ApeCoin IOMAP

ApeCoin IOMAP model

The Relative Strength Index (RSI) has formed a bearish divergence from the price, which could put APE in a precarious position where losses may overwhelm support at $6.00.


Information on these pages contains forward-looking statements that involve risks and uncertainties. Markets and instruments profiled on this page are for informational purposes only and should not in any way come across as a recommendation to buy or sell in these assets. You should do your own thorough research before making any investment decisions. FXStreet does not in any way guarantee that this information is free from mistakes, errors, or material misstatements. It also does not guarantee that this information is of a timely nature. Investing in Open Markets involves a great deal of risk, including the loss of all or a portion of your investment, as well as emotional distress. All risks, losses and costs associated with investing, including total loss of principal, are your responsibility. The views and opinions expressed in this article are those of the authors and do not necessarily reflect the official policy or position of FXStreet nor its advertisers. The author will not be held responsible for information that is found at the end of links posted on this page.

If not otherwise explicitly mentioned in the body of the article, at the time of writing, the author has no position in any stock mentioned in this article and no business relationship with any company mentioned. The author has not received compensation for writing this article, other than from FXStreet.

FXStreet and the author do not provide personalized recommendations. The author makes no representations as to the accuracy, completeness, or suitability of this information. FXStreet and the author will not be liable for any errors, omissions or any losses, injuries or damages arising from this information and its display or use. Errors and omissions excepted.

The author and FXStreet are not registered investment advisors and nothing in this article is intended to be investment advice.

Join Telegram

Recommended content


Recommended Content

Editors’ Picks

Why crypto may see a recovery right before or shortly after Bitcoin halving

Why crypto may see a recovery right before or shortly after Bitcoin halving

Cryptocurrency market is bleeding, with Bitcoin price leading altcoins south in a broader market crash. The elevated risk levels have bulls sitting on their hands, but analysts from Santiment say this bleed may only be cauterized right before or shortly after the halving.

More Cryptocurrencies News

Manta Network price braces for volatility as $44 million worth of MANTA is due to flood markets

Manta Network price braces for volatility as $44 million worth of MANTA is due to flood markets

Manta Network (MANTA) price was not spared from the broader market crash instigated by a weakness in the Bitcoin (BTC) market. While analysts call a bottoming out in the BTC price, the Web3 modular ecosystem token could suffer further impact.

More Manta Network News

Bitcoin price uptrend to continue post-halving, Bernstein report says as traders remain in disarray

Bitcoin price uptrend to continue post-halving, Bernstein report says as traders remain in disarray

Bitcoin is dropping amid elevated risk levels in the market. It comes as traders count hours to the much-anticipated halving event. Amid the market lull, experts say we may not see a rally until after the halving. 

More Bitcoin News

OMNI post nearly 50% loss after airdrop and exchange listing

OMNI post nearly 50% loss after airdrop and exchange listing

Omni network (OMNI) lost nearly 50% of its value on Wednesday after investors dumped the token following its listing on top crypto exchanges. A potential reason for the crash may be due to the wider crypto market slump.

More Omni Network News

Bitcoin: BTC’s rangebound movement leaves traders confused

Bitcoin: BTC’s rangebound movement leaves traders confused

Bitcoin (BTC) price has been hovering around the $70,000 psychological level for a few weeks, resulting in a rangebound movement. This development could lead to a massive liquidation on either side before a directional move is established. 

Read full analysis

BTC

ETH

XRP